


INTRODUCTION
The global population aged 60 years and older is projected to nearly double by 2050.1) While previous research has indicated that increasing physical activity could potentially extend the average lifespan by 0.68 years,2) there is a global trend towards increased sedentary behavior and reduced habitual daily physical activity. A decline in physical activity is a significant public health challenge and a primary risk factor for non-communicable diseases, mortality,3) and the development of cardiovascular disease (CVD), primarily attributable to its adverse effects on arterial health.4)
Several parameters are currently used to assess arterial stiffness, including pulse wave velocity (PWV), cardio-ankle vascular index (CAVI), and ankle-brachial index (ABI). The PWV is considered the gold standard for measuring arterial stiffness, whereas the CAVI provides a blood pressure-independent evaluation. The ABI is widely used to assess peripheral arterial disease (PAD).5) However, different measurement methods for assessing arterial stiffness can yield different results. Furthermore, the relationship between optimal physical activity levels and arterial stiffness is controversial, with studies suggesting a negative association,6) whereas others have reported no significant association.7)
Recent evidence suggests that assessing physical activity levels using wearable step-counting devices to measure daily walking among older adults8) can provide valuable insights. Higher daily step counts are associated with increased time spent on higher-intensity activities.9) Physical activity levels can be categorized according to daily step counts, in which <5,000, 5,000ã7,400, 7,500ã9,999, and ãË10,000 steps indicate sedentary, low, somewhat active, and active lifestyles, respectively.10)
The public health message recommends a daily 10,000-step goal,11) which is associated with a reduced risk of all-cause mortality, cancer, and CVD.12) Additionally, a higher daily step count is associated with a decreased risk of all-cause mortality in older adults in Japan.13) Mortality rates decrease gradually, plateauing at approximately 7,500 steps per day.14) Furthermore, the results of a comprehensive meta-analysis showed that individuals who walk 6,000ã9,000 steps per day experience a 40%ã50% lower risk of CVD compared with those who walk only 2,000 steps per day.15) Moreover, individuals who averaged approximately 8,959 steps per day showed a 40.36% lower risk of all-cause mortality compared with those who averaged 4,183 steps per day.16) However, older adults often encounter challenges in reaching this daily step target due to various factors, including the type of step-counting device, participant demographics, age group, and sample size.14)
To date, research on daily step counts has produced varying results, and evidence is limited regarding the relationship of daily step counts <10,000 to arterial stiffness in older adults within this demographic. A previous study on fall risk among older individuals in Thailand established a threshold of ãË5,000 steps/day.17) A prior investigation suggested <5,000 steps/day as a cutoff for identifying a sedentary lifestyle among older individuals.11) Hence, this study adopted a walking cutoff of <5,000 steps/day, following the criteria for older individuals with moderate activity per week, to investigate the association between daily step count and specific parameters related to arterial stiffness, including PWV, CAVI, and ABI, within the context of community-dwelling older adults with a sedentary lifestyle (<150 minutes of moderate activity per week) from Hatyai Chivasukãs Health Promotion Center. The findings of this study may contribute to the development of effective public health recommendations and targeted interventions that utilize daily step counts.
MATERIALS AND METHODS
Study Design and Participants
This cross-sectional study enrolled 48 retired individuals who visited the Health Promotion Center for routine health checkups between December 2018 and March 2019. This health center offers healthcare services to individuals within an urban area in the Hatyai district and nearby communities. A researcher visited the community health center and explained the study's aim and scope to the participants. Potential participants who expressed interest and met the research criteria underwent subsequent evaluations. The inclusion criterion was physical inactivity, defined as <150 minutes of moderate activity per week based on self-reported data. Moreover, the participants were required to be capable of walking independently without the need for support or mobility aids. None of the enrolled participants were taking medications, including antihypertensive, lipid-lowering, or antihyperglycemic drugs, and were nonsmokers. The exclusion criteria were musculoskeletal issues, such as lower muscle pain and bone fractures, and those with symptoms such as headache, fever, nausea, or vomiting during the examinations. Moreover, older adults with a body mass index (BMI) >35 kg/m2 were excluded because of their potential susceptibility to gait and balance issues and an increased risk of falls.18) Additionally, we excluded participants who had consistently worn their pedometers for a minimum of 5 days for at least 10 hours per day.
Before enrollment, all participants provided written informed consent, following the ethical guidelines outlined in the Declaration of Helsinki. Detailed information regarding the study was provided to all participants, who signed the written informed consent forms before any measurements were obtained. This study was approved by the Research Ethics Committee of the Faculty of Medicine, Prince Songkla University (No. REC 61-157-19-2). Also, This study complied the ethical guidelines for authorship and publishing in the Annals of Geriatric Medicine and Research.19)
Each participant underwent an initial comprehensive assessment, which included physical measurements, blood sample collection, and pedometer-based evaluations. Subsequently, at the second follow-up visit, seven days after the first visit, the participants were requested to return the pedometer to a researcher. Hemodynamic and arterial stiffness parameters were assessed.
Physiological Parameter Assessment
All anthropometric measurements were performed by trained research assistants. Body weight was measured using a calibrated digital scale, with the participants wearing light clothing. Height was measured using a portable stadiometer while the participants stood barefoot. BMI was calculated as body weight (kg) divided by height in meters squared (m2). We classified the participants' obesity status using a threshold BMI of >25 kg/m2.
Hemodynamic Parameter Assessment
Before collecting blood samples, trained researchers recorded the participantsã hemodynamic parameters. The resting heart rate was measured using the right arm (Masimo, Irvine, CA, USA). Blood pressure (BP) was measured using a mercury sphygmomanometer (Riester, Jungingen, Germany). The participants were instructed to rest quietly in a relaxed position for 10 min before the BP readings were obtained. For comfortable seating and arm placement at heart level on the table, a cuff was wrapped around the arm and positioned approximately 2.5 cm from the elbow. Multiple systolic blood pressure (SBP) and diastolic blood pressure (DBP) measurements were obtained, and the average of the three measurements was calculated. We calculated pulse pressure (PP) as PP = SBPãDBP, whereas mean arterial pressure (MAP) was calculated as MAP = DBP + 1/3(PP). We defined hypertension as SBP ãË140 mmHg and/or DBP ãË90 mmHg.
Blood Sample Collection
We performed a series of blood analyses, including fasting blood glucose (FBG) levels and lipid profiles. Venous blood was collected after an overnight fast of at least 8 hours and processed immediately. FBG levels were measured using standard glucometer strips (AccuCheck Active; Roche Diagnostic Corporation, Mannheim, Germany). FBG levels were used to assess diabetes mellitus (DM; ãË126 mg/dL). Lipid profile assays for low-density lipoprotein (LDL), high-density lipoprotein (HDL-C), triglycerides (TG), and total cholesterol (TC) were conducted by certified nurses using blood drawn in lithium heparin tubes. We classified dyslipidemia based on the following criteria: low HDL-C ãÊ40 mg/dL; high TG ãË200 mg/dL; high LDL-C ãË160 mg/dL; and high TC ãË240 mg/dL.20)
Daily Step Count Assessment
Daily step counts were monitored using a pedometer (HJA-404; Omron Healthcare Co. Ltd., Tokyo, Japan). During the initial visit, the participants received detailed instructions on how to correctly attach and remove the pedometer. The participants were instructed to wear the pedometer at the waist, specifically over the midline of the right thigh, for 7 consecutive days, encompassing 5 weekdays and 2 weekends. This period extended from morning awakening to bedtime, excluding periods of sleep and water-based activities. The participants were requested to capture a photographic record of their daily step count at the end of each day and subsequently reset the pedometer to zero the next day. The average daily step count over these 7 days was calculated.
The participantsã daily step counts were recorded and categorized into two distinct physical activity groups: group 1 (<5,000 steps/day) and group 2 (5,000ã9,999 steps/day). This categorization resulted in the inclusion of 60 participants in the initial assessments. However, valid data were obtained for 48 older adults, as the remaining 12 participants did not meet the inclusion criteria for various reasons, including neglecting to provide photographs of their daily step counts, not wearing the pedometer for at least 5 days, and experiencing reduced step counts due to adverse weather conditions or leg pain.
Arterial Stiffness Assessments
CAVI, PWV, and ABI were measured using a Vasera VS-3000 device (Fukuda Denshi Co. Ltd., Tokyo, Japan). Cuffs were systematically applied to both arms and ankles for BP measurements after a 10-minute rest period in the supine position. The CAVI was automatically calculated. The brachial-ankle pulse wave velocity (baPWV) was obtained to detect brachial and ankle pulse waves and was automatically averaged. Abnormal CAVI values were defined as those ãË9.0.21) Additionally, a PWV ãË10 m/s indicated significant alterations in aortic function.22) The device assessed the ABI of the lower limbs. This involved recording the SBP in the brachial artery at each elbow and the SBP in the posterior tibial arteries at each ankle. We defined PAD as an ABI reading of ãÊ0.90 at rest.5)
Statistical Analyses
All data were analyzed using IBM SPSS Statistics for Windows, version 23.0 (IBM Corp., Armonk, NY, USA). Before performing the analyses, we assessed the normality of the variables using the KolmogorovãSmirnov test. Continuous variables are represented as meanôÝstandard deviation (for normally distributed data) or median and interquartile range (for non-normally distributed data). Categorical variables are represented as numbers and percentages. We performed intergroup comparisons of continuous variables using an independent t-test for normally distributed data; otherwise, the MannãWhitney U test was used. We analyzed categorical variables using the chi-squared test. The relationship between daily steps and various clinical parameters was tested using Pearson or Spearman correlations, as appropriate. For sequential data, multiple regression analysis was used to assess the associations between the selected variables adjusted for age, BMI, sex, BP, and lipid profile. The significance level was set at p<0.05.
RESULTS
This study included 48 older adults who completed the test and were physically inactive. The physiological, hemodynamic, and biochemical characteristics of the study participants are represented in Table 1. Regarding the sex distribution, 8.3% of male participants and 91.7% of female participants were divided into two distinct groups based on their daily step counts. Groups 1 and 2 exhibited median daily step counts of 3,678 and 6,578 steps, respectively (p<0.001). Most of the hemodynamic and biochemical characteristics were similar between the two groups; however, individuals with <5,000 daily steps had a higher SBP than those with higher daily step counts (132 vs. 127 mmHg, p=0.026). Additionally, the group with a daily step count >5,000 had a higher HDL-C level (67.850ôÝ16.684 vs. 57.679ôÝ13.617 mg/dL, p=0.025). However, there were no statistically significant differences in height, weight, or BMI between the daily step count subgroups (Table 1).
Health assessments revealed that individuals who walked <5,000 steps per day were more likely to exhibit hypertension, elevated CAVI (ãË0.9), and increased (PWV ãË10) compared to their more physically active counterparts (p=0.007, p=0.035, and p=0.004, respectively) (Tables 1, 2). PWV was significantly higher among participants with lower daily step counts than in the other daily step count group (10.375ôÝ2.166 vs. 8.610ôÝ1.689 m/s, p=0.004). Conversely, the CAVI and ABI values did not differ significantly across the daily step count groups (Table 2).
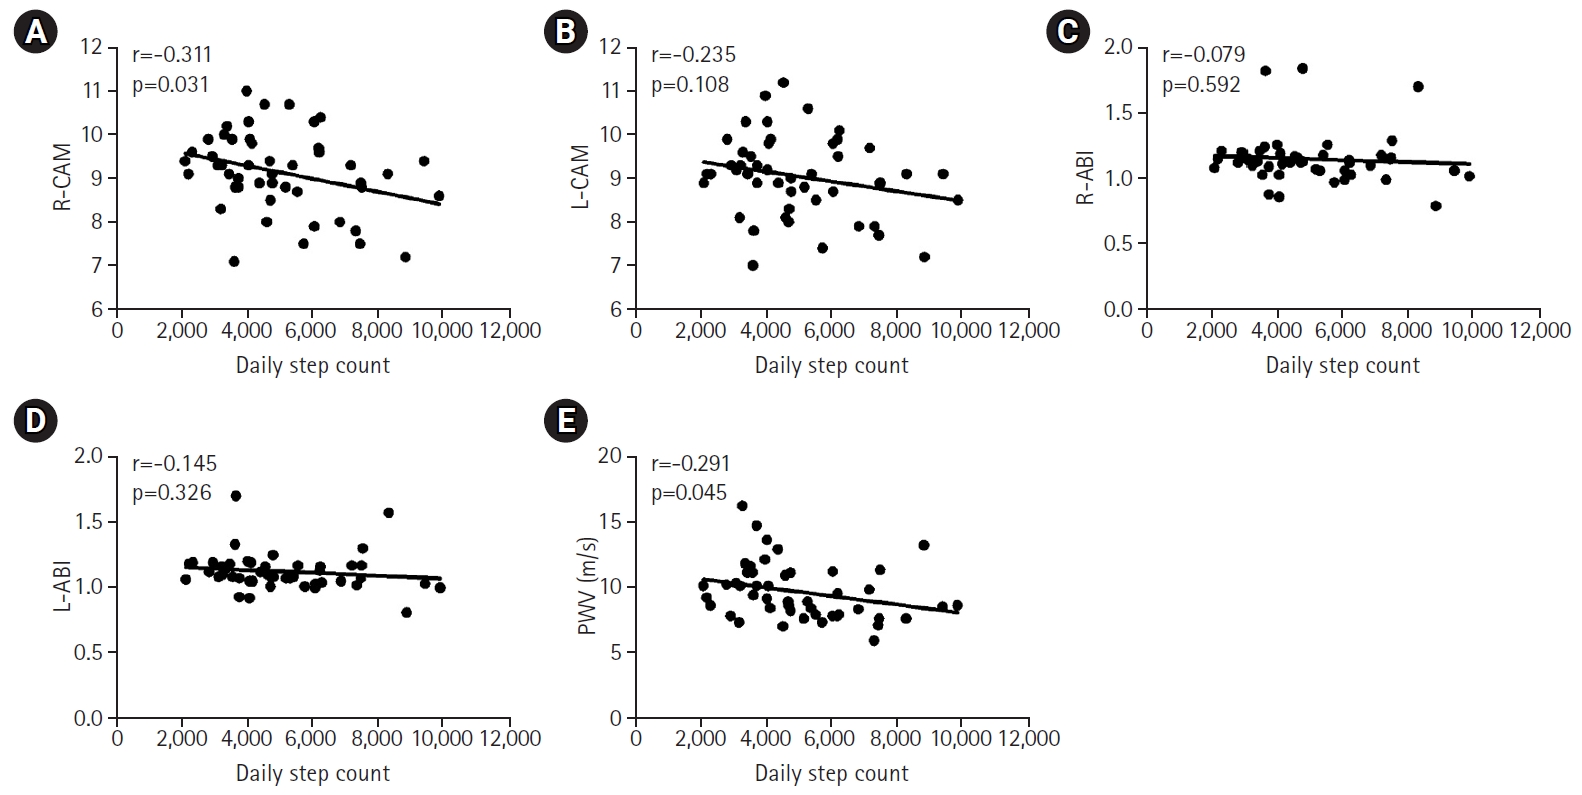
The correlations between baseline characteristics and daily step counts for all participants are represented in Table 3. The physiological parameters were not significantly correlated with daily step counts. However, we observed a positive correlation between HDL-C level and daily step count (r=0.316, p=0.029). Correlation analysis revealed an inverse relationship between daily step count and R-CAVI (r=-0.311, p=0.031) and PWV (r=-0.291, p=0.045) (Fig. 1A, 1E). Moreover, when additional arterial stiffness parameters were integrated as explanatory variables in multiple regression analysis, PWV exhibited a negative correlation with daily step counts (öý=-0.290, p=0.047) (Table 4).
DISCUSSION
The results of this study provide information on the relationship between the daily step counts of older adults who take <10,000 steps and various parameters associated with arterial stiffness. A previous study suggested a recommended daily step count goal of 7,000ã10,000 steps for older adults.11) However, our findings revealed a median daily step count of 4,645 (range, 2,099ã9,876 steps), below the previously recommended levels. Another study reported that older adults without chronic diseases and/or smoking habits averaged 6,011ôÝ2,089 steps per day.23) In Japan, older adults who wore accelerometers on their waists recorded a daily step count of approximately 5,412ôÝ2,878 steps per day.24) Additionally, a cross-sectional study involving Japanese community dwellers aged 65ã96 years observed an average daily step count of 5,850ôÝ169.25) Several factors contribute to fewer daily steps among older individuals, including differences in devices, age demographics, geographical location, health conditions, and sample sizes.23,26)
Our analysis revealed an inverse relationship between daily step counts and PWV. Although the correlation coefficient may appear relatively small, it is statistically significant. This finding has significant implications for patient health. The negative correlation suggests an association between increased daily step count and decreased PWV, emphasizing the potential cardiovascular benefits of regular physical activity. The results of a meta-analysis established a significant inverse correlation between daily step count and PWV. Participants with a daily step count of at least 7,500 showed a reduction in carotid-femoral PWV (cfPWV).9) Furthermore, a previous study involving older Japanese individuals demonstrated that a 17-week pedometer-based physical activity program led to a decrease in baPWV through an increase in daily step count.27) Earlier studies reported that adding 1,000 steps per day resulted in a 0.1 m/s decrease in cfPWV in adults with type 2 DM or hypertension.28)
The results of this study demonstrated that individuals who took <5,000 steps per day had a higher likelihood of experiencing arterial stiffness, as assessed by CAVI values >9, compared to that in the other groups. However, our findings failed to establish a significant association between daily step count, CAVI, and ABI. One possible explanation for these findings could be that older adults with an abnormal ABI may have experienced discomfort or limitations in their walking ability, which could have inhibited their participation in our study. Additionally, patients with PAD who took <7,000 steps per day exhibited lower ambulatory function and health-related quality of life compared with those who took 7,000 and 10,000 steps per day.29)
Accumulating evidence suggests that increasing the daily step count can improve cardiovascular health. Adding an extra 1,000 daily steps is significantly correlated with a reduced overall risk of CVD and all-cause mortality.30) For adults aged >70 years, each additional 1,000 steps per day is associated with a 13% decrease in the risk of all-cause mortality.26) Additionally, older women who averaged approximately 4,400 steps/day exhibited significantly lower mortality rates over a 4.3-year follow-up period compared with those who averaged approximately 2,700 steps/day. These health benefits, including anti-atherosclerotic properties and enhanced cardiovascular health, were observed even when daily step counts fell below the conventional threshold of 10,000 steps/day.15,30) This improvement in vascular health can be attributed to the ability of physical activity to increase blood flow, induce vasodilation, reduce oxidative stress and inflammation, and enhance nitric oxide release.27)
Our study results demonstrated that individuals who took more daily steps tended to have lower SBP compared with individuals who took fewer daily steps. Additionally, we observed a lower incidence of hypertension among individuals with higher daily step counts. Previous studies have reported lower SBP and DBP in the active group, averaging >4,227 daily steps, compared to those in the inactive group.31) Similarly, participants categorized as somewhat active and active consistently displayed a lower SBP than their inactive counterparts.32) Moreover, individuals with hypertension tended to take fewer daily steps than those with normal BP.31) However, our study results did not establish a significant relationship between the number of steps and BP parameters. This finding is in contrast to previous reports of significant negative relationships between accumulated daily steps and both SBP and DBP.31) A pedometer-based walking program requiring either a daily accumulation of at least 10,000 steps33) or an additional 3,000 steps/day34) lowered SBP, DBP, or both in overweight Thai participants33) and patients with hypertension.34) One explanation for the effect of increasing daily step counts on lowering BP is an improvement in exercise capacity and a reduction in sympathetic nerve activities.35)
Our study results are consistent with previous studies that reported higher HDL-C levels in women aged 50ã60 years with 5,600ã9,099 steps compared with those with <5,600 steps.36) In addition, these findings revealed an association between the number of steps and HDL-C levels. Consequently, increased HDL-C levels have been associated with stepping-based physical activity, especially those with high intensity.37) Therefore, increased physical activity levels improve lipid profiles. Lower TG levels were significantly associated with high step volume in multiethnic Asian populations.37) TC levels improved in participants with >5,000 steps per day compared with those who took fewer steps, while individuals with ãË7,500 steps per day exhibited better LDL-C levels.32) However, our study results did not establish a significant relationship, possibly due to the low intensity of the activities involved.
Although the statistically significant differences in SBP and HDL levels between the groups did not reach clinical significance at the individual level, it is important to highlight the potentially meaningful implications for cardiovascular health, particularly in the context of the long-term effects on morbidity and mortality. Additionally, the higher HDL levels we observed in individuals with greater daily step counts were consistent with established cardiovascular health indicators. The cumulative effect of increased HDL levels associated with regular physical activity suggests considerable cardiovascular benefits at the population level.
This study has several limitations. First, this was a single-center study with a relatively small sample size. Additionally, the cross-sectional design may restrict our capacity to establish causal relationships among the variables. Furthermore, the participants were not randomly selected from the population, potentially introducing a selection bias. Additionally, participants with specific medical conditions such as systolic dysfunction, atrial fibrillation or flutter, aortic disease, or valvular heart disease may not have been excluded from this study. These conditions can affect arterial stiffness.38) Finally, we did not exclude patients with psychological conditions, which may have impacted the participantsã walking habits. These limitations should be considered and addressed in future studies.
In conclusion, in this study, higher daily step counts were correlated with lower PWV in older adults. Future research should prioritize targeted interventions that focus on motivation, optimal activity intensity, and long-term cardiovascular effects in older adults. Regarding preventive strategies, initiatives such as implementing awareness campaigns on the relationship between daily step count and arterial health, promoting step-monitoring devices, and providing personalized lifestyle recommendations could be effective. Collaborations between healthcare professionals and community leaders can enhance the reach and impact of these preventive efforts.