


INTRODUCTION
The Japanese population is aging rapidly. In 2020, the aged population (Ōēź65 years) accounted for 28.8% of the total Japanese population and is predicted to increase to 38.1% in 2060.1) In a super-aged society such as Japan, disability in older adults is an important issue. At the individual level, disability is associated with limited activity and a decreased quality of life. Consequently, family care and financial burdens increase at the macro level.
Since 2000, the Japanese government has implemented long-term care insurance (LTCI), depending on the degree of physical and mental disability, for every Japanese adult aged Ōēź65 years. Eligibility is assessed by a questionnaire about activities of daily living (ADL) and subsequently decided by the Certification Committee of Needed Long-Term Care based on the initial computer evaluation, home-visit report, and a family doctorŌĆÖs opinion.2) The seven LTCI certification levels include support levels 1ŌĆō2 and care need levels 1ŌĆō5. Care need levels require more care than support levels, with more care required at higher levels. The LTCI certification levels are defined as follows: support level 1, ŌĆ£requiring some support for instrumental activities of daily living (IADL) but independent in basic ADLŌĆØ; care level 1, ŌĆ£declining IADL ability beyond support levels, with partial care requiredŌĆØ; care level 3, ŌĆ£significantly declining ADL and IADL abilities, with almost constant care requiredŌĆØ; and care level 5, ŌĆ£requiring care in all tasks of ADL to live.ŌĆØ The LTCI costs are increasing annually, exceeding 10 trillion yen per year in 2018.3) As the aged population is expected to increase, the early identification of high-risk individuals for future disability is essential to delay or decrease LTCI certification.
Disability is an adverse outcome of frailty.4) Older adults with frailty have a higher risk of future disability compared to those without frailty.5,6) Previous studies have shown that frailty is associated with the incidence of disability using the Japanese LTCI certification.7-9) However, most previous studies integrated all five levels of care need of LTCI certification as a single outcome, although the disability levels differ widely, ranging from almost independent in basic ADL (corresponding to care need level 1) to requiring care in all ADL tasks (level 5). Moreover, while previous studies have investigated the association of frailty with the incidence of mild and severe disabilities separately,10) few have investigated this topic according to Japanese LTCI certification.
We hypothesized that frailty is differently associated with the incidence of mild and severe disabilities. Therefore, this study investigated the association between frailty and the incidence of mild and severe disabilities separately in older adults.
MATERIALS AND METHODS
Participants
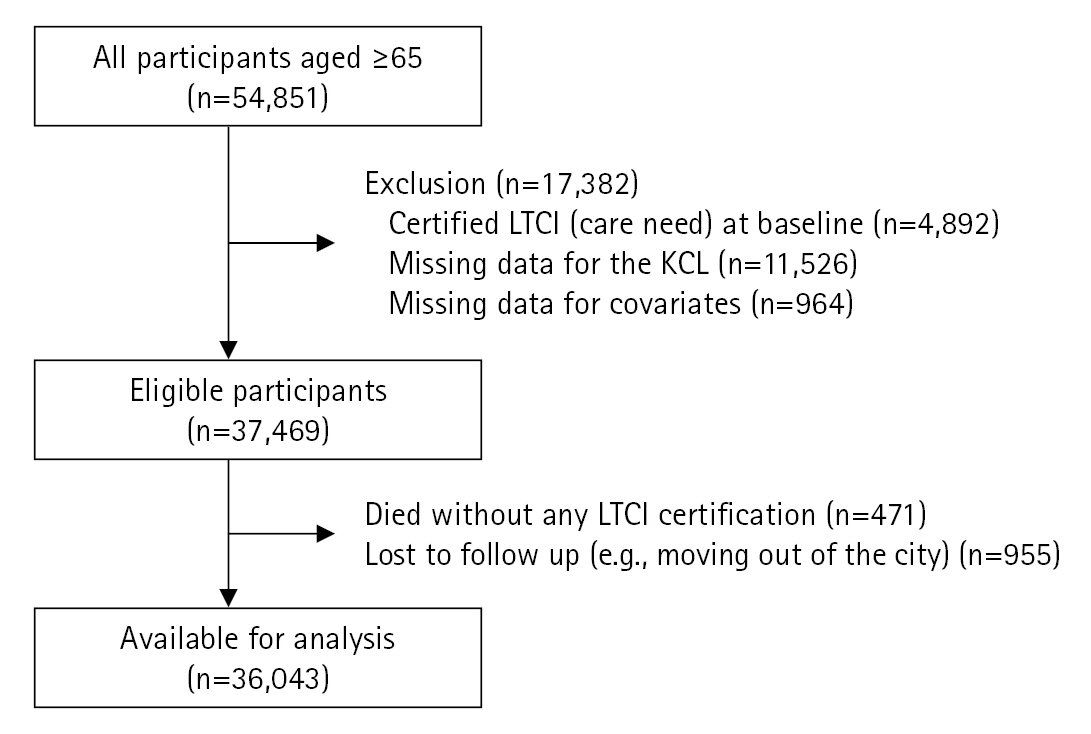
This 3-year retrospective cohort study was part of the Okayama Study, a longitudinal retrospective cohort study conducted in Okayama City. Okayama City, located in western Japan, is the capital city of Okayama Prefecture. The Okayama Study investigated the relationship between behavior and LTCI certification. The basic health examination used in this study included questions related to medical history, self-rated health, lifestyle habits, and physical activity. The cohort was followed up for up to 10 years to obtain information on LTCI certification. The participants were 54,851 community-dwelling adults aged Ōēź65 years in Okayama City who underwent a basic health examination in 2006 or 2007. Okayama City had a population of 660,996 in 2006, with 125,954 (19.1%) adults aged Ōēź65 years.11) The inclusion criteria were age Ōēź65 years at the baseline measurement and residents of Okayama City. We excluded individuals who were already certified in LTCI (care need) at baseline, had missing data on frailty status or covariates, died without any LTCI certification, and were lost to follow-up (e.g., moving out of the city) during the follow-up period.
This study was approved by the Ethics Committee of the Okayama University Graduate School of Medicine, Dentistry, and Pharmaceutical Sciences and Okayama University Hospital (No. K2106-038), which waived the requirement for informed consent because this study was retrospective and the data anonymized for analysis. This study followed the ethical guidelines for authorship and publication in the Annals of Geriatric Medicine and Research.12)
Exposure: Frailty Status
We applied the Kihon Checklist (KCL) to assess frailty status. The KCL is a questionnaire developed in Japan to identify older adults who are more likely to need care. It is a self-administered questionnaire with ŌĆ£yesŌĆØ and ŌĆ£noŌĆØ responses. It consists of 25 items divided into seven domains: ADL, physical function, nutrition, oral function, housebound, cognitive function, and depressive mood. One point was added for responses to each question on whether they had a problem, with a higher total score indicating a higher risk of disability. A previous study13) reported that KCL is associated with frailty status, as defined by the Cardiovascular Health Study (CHS) frailty index, a representative evaluation of frailty status. Based on that study, we defined frail as a total KCL score of Ōēź8 points, pre-frail as 4ŌĆō7 points, and robust as 0ŌĆō3 points.
Outcome: Mild and Severe Disabilities
We divided LTCI certification (care need levels 1ŌĆō5) into mild (care need levels 1 or 2) and severe (care need levels 3ŌĆō5) disabilities, which were defined as the outcomes. Some definitions of the LTCI certification levels are described above. At care need levels Ōēź3, ADL and IADL become severely restricted and the burden on the family increases.14,15) Therefore, we defined the outcome as mild and severe disabilities in the new LTCI certification. We obtained information on LTCI certifications at the end of each year.
Covariates
The following baseline characteristics were recorded: age, sex, comorbidities, alcohol consumption, and smoking status. The comorbidities included heart disease, renal disease, diabetes, and anemia. We selected these variables as covariates because previous studies have demonstrated that they might be confounders between frailty and future disability,16-18) and these data were available in our database.
Statistical Analysis
After descriptive analysis, multinomial logistic regression analysis was used to estimate the odds ratio (OR) and 95% confidence interval (CI) for the associations between frailty status and incidence of mild and severe disabilities. Model 1 was a crude model and Model 2 was adjusted for age and sex. Model 3 was additionally adjusted for comorbidities, alcohol consumption, and smoking status.
Stratified analyses were performed to assess the association between frailty and the incidence of mild and severe disabilities by age group. We stratified the participants into two groups: pre-old (age 65ŌĆō74 years) and old (Ōēź75 years).19)
All analyses were performed using Stata/SE 17.0 (Stata Corp LP, College Station, TX, USA).
RESULTS
Fig. 1 shows the flow chart of the study participants. We excluded 17,382 of the 54,851 participants with certified LTCI (care need) at baseline (n=4,892), missing KCL scores (n=11,526), and missing covariate data (n=964). In addition, 471 participants died without any LTCI certification and 955 participants were lost during the 3-year follow-up. Finally, we analyzed 36,043 participants.
Table 1 shows the baseline characteristics of the participants. The median age of the participants was 74 years and 13,166 (36.5%) were male. The prevalence of frail was 21.0% (n=7,575), prefrail was 31.5% (n=11,357), and robust was 47.5% (n=17,111).
Table 2 presents the numbers of participants according to their disability level. Overall, 33,434 (92.8%) participants had no disability, 1,809 (5.0%) participants certified mild disability, and 800 (2.2%) participants certified severe disability.
Table 3 presents the results of the multinomial logistic regression analysis. In the fully adjusted model, the ORs comparing frail to robust and prefrail to robust for mild disability were 3.85 (95% CI, 3.36ŌĆō4.42) and 1.82 (95% CI, 1.58ŌĆō2.10), respectively. Similarly, the corresponding ORs for severe disability were 4.35 (95% CI, 3.55ŌĆō5.34) and 1.78 (95% CI, 1.43ŌĆō2.21), respectively.
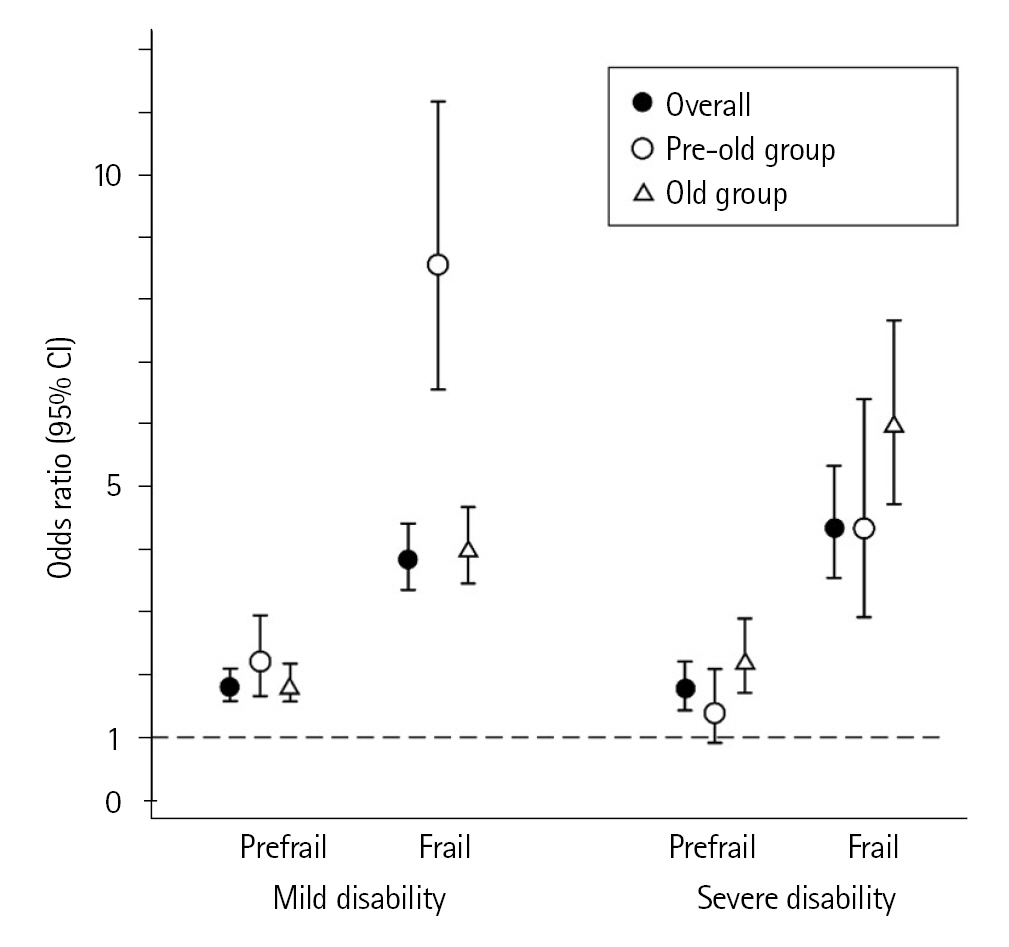
Table 4 and Fig. 2 present the results of stratified analysis by the two age groups (pre-old aged 65ŌĆō74 years; old Ōēź75 years). The pre-old group with frail (OR=8.56; 95% CI, 6.56ŌĆō11.17) showed a higher association with mild disability compared to that in the old group with frail (OR=4.02; 95% CI, 3.46ŌĆō4.68). In contrast, the old-age group with frailty showed a higher association with severe disability (OR=6.02; 95% CI, 4.73ŌĆō7.67) compared to that in the pre-old group (OR=4.33; 95% CI, 2.92ŌĆō6.41).
DISCUSSION
Using multinomial logistic regression analysis, we investigated the association between frailty and the incidence of mild and severe disabilities separately over a 3-year follow-up period. Both prefrail and frailty were associated with the incidence of mild and severe disabilities. Notably, in frail individuals, we observed different patterns of association between the pre-old and old age groups. Regarding mild disability, the pre-old group showed a higher association than the old group. Conversely, for severe disability, the old group showed a higher association than the pre-old group.
These results suggested that the older adults with frail were more likely to have severe disability. Generally, the physiological reserve gradually decreases with aging, and older adults are likely to experience decreased ADL function due to relatively minor stressor events.20) Furthermore, older age is associated with a low recovery of ADL function.20) Therefore, older adults may be more strongly affected by frailty and more likely to have severe disability compared to pre-old adults. In contrast, our results suggested that the pre-old adults with frail were more likely to have mild disability. Generally, the prevalence of frailty increases with age. A previous systematic review and meta-analysis reported an increased prevalence of frailty in Japan among adults in their late 70s and beyond.21,22) Therefore, frail individuals, despite pre-old age, may be relatively more vulnerable and their ADL function more likely to decline to mild disability, without progressing to severe disability.
Despite the different patterns between the pre-old and old age groups described above, the importance of preventing frailty may be the same across all ages. The causes of LTCI certification differ by age group.23) Specifically, lifestyle diseases (e.g., stroke, heart disease, and cancer) are more prevalent in the pre-old group, whereas the prevalence of frailty-related factors (e.g., dementia, fracture and fall, joint disorder, and weakness) is higher in the old group. Although the proportion of adults with frailty as a cause of disability may be low in the pre-old group of adults, those with frailty may be at high risk. In contrast, frailty may be a major factor directly related to severe disability in the old group. Therefore, interventions to prevent and improve frailty are essential to prevent the progression of disability.
A major strength of this study is the use of a large population-based sample and the reporting of separate ORs of frailty associated with mild and severe disabilities. However, this study has several limitations. First, more than half of the target population did not participate in health examinations. Our results might have been underestimated because the health status of older adults who did not participate in health examinations was reportedly poor.24) Second, there was the potential for unmeasured confounding. For example, other comorbidities (e.g., dementia and stroke) and social factors are reportedly associated with the incidence of disability.25,26) We could not obtain this information because this study was retrospective and used health examination data from the local government. Third, our results might have underestimated the incidence of disability since it is a factor that is strongly associated with death. This study did not include individuals who did not apply for LTCI or who became disabled due to rapid progression and died without LTCI certification. Fourth, the KCL is not an internationally representative scale for assessing frailty. Although a previous study reported an association between the CHS frailty index and reliability,13,27) the comparability requires consideration. Fifth, using a scale that primarily assesses disability may lead to errors in assessing frailty since disability is very often a consequence of frailty. Future studies should apply frailty assessment scales that are essentially independent of disability. Lastly, we were unable to determine the cause of the LTCI certification as this information was not available. Therefore, how frailty affects the incidence of disabilities remains unclear.
In conclusion, the results of our study showed that both prefrail and frail were associated with the incidence of mild and severe disabilities, with different patterns of association between the pre-old/old age groups. Our findings suggest that different interpretations and approaches to frailty should be considered by age group for disability prevention in older adults.