


INTRODUCTION
The prevalence of overt and subclinical hypothyroidism and metabolic syndrome (MS) is increasing worldwide owing to aging and increasing obesity. Thirty percent of the individuals treated with levothyroxine (LT4) are >70 years of age.1) However, elevated thyroid-stimulating hormone (TSH) levels caused by aging may be due to the adaptation of the thyroid axis or a deficit of thyroid hormones. Therefore, treatment recommendations should be specific to this particular age group, and the treatment effectiveness should be monitored.
MS is characterized by a combination of insulin resistance (IR), dyslipidemia, arterial hypertension (HT), and central obesity. Body mass index (BMI) is widely used to assess the presence of geriatric syndromes such as sarcopenia and malnutrition.2,3) Therefore, we used BMI for MS diagnosis in this study as it is more practical in geriatric medicine and is included in the World Health Organization (WHO) and American Association of Clinical (AACE) criteria.4-6)
Both MS and hypothyroidism promote atherosclerosis. Therefore, the cardiovascular (CV) risk increases in the presence of both conditions. The Framingham Risk Score calculates the CV risk and can predict the occurrence of CV events.7,8) LT4 replacement therapy may reduce the risk of MS and atherosclerosis by decreasing cholesterol levels.9) However, literature on the prevalence of MS in older patients as assessed using different criteria is scarce,10) and the predictability of both MS definitions for CV risk has not been studied in older patients treated with LT4. Therefore, we investigated the prevalence and metabolic features of the two definitions of MS in older patients with chronic thyroiditis treated with LT4 and compared them with controls without chronic thyroiditis. We also investigated the ability of both criteria to identify individuals with LT4 treatment at a high CV risk based on the Framingham Risk Score.
MATERIALS AND METHODS
Subjects
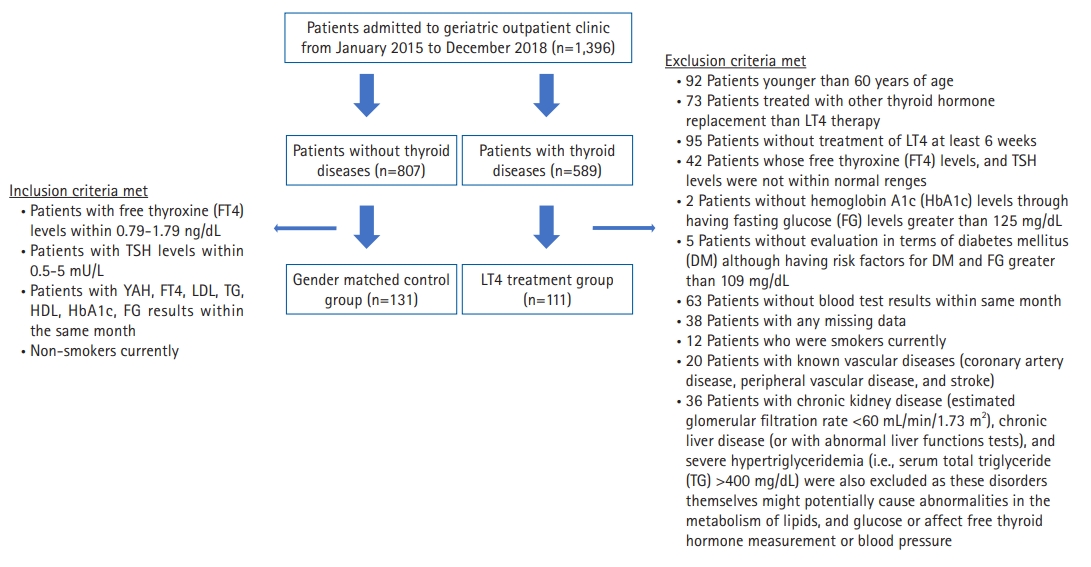
This observational, cross-sectional, retrospective study assessed 1396 patients (589 and 807 patients with and without thyroid disease, respectively) who attended the geriatric outpatient clinic at the Medical Faculty Hospital between January 2015 and December 2018. Among patients with thyroid-related disorders, this study selected individuals diagnosed with chronic thyroiditis confirmed by thyroid ultrasonography and/or anti-thyroid peroxidase (anti-TPO) antibodies,11) as well as euthyroid patients treated with LT4 for at least 6 weeks. The exclusion criteria for the LT4 treatment group, inclusion criteria for the control group, and number of patients are shown in Fig. 1. Finally, this study enrolled 111 of 589 patients who met the inclusion criteria. Of the 807 patients, we enrolled 131 patients who did not have thyroid diseases in the sex-matched control group. Overall, this study enrolled a total of 242 patients. Their baseline demographic information, such as age; sex; physical data, including body height and body weight; and systolic and diastolic blood pressure, were recorded. Histories of smoking status, diabetes mellitus (DM), dyslipidemia, HT, and laboratory measurements were obtained from electronic medical records.
The study was conducted in accordance with the ethical principles stated in the “Declaration of Helsinki” and approved by the Ege University Human Research Ethics Committee along with the permission for the use of patient data for publication purposes (Reference number/Protocol No. 18-11.1T/1). Informed consent was not obtained from participants as this was a retrospective chart review. This study complied the ethical guidelines for authorship and pubhishing in the Annals of Geriatric Medicine and Research.12)
Laboratory Measurements
Hospital laboratory values measured in the same month were recorded, including levels of serum TG (mg/dL), total cholesterol (TC; mg/dL), high-density lipoprotein cholesterol (HDL-C; mg/dL), FG (mg/dL), glycated hemoglobin (HbA1c; %, mmol/mol), anti-TPO antibody (IU/mL), TSH (mIU/L), and FT4 (ng/dL). All measurements were performed using routine laboratory methods.
Definitions
The diagnostic criteria for MS are shown in Table 1. Given the type of research design, our ability to evaluate waist circumference (WC) and perform oral glucose tolerance tests (OGTTs) was low. Both the waist-to-hip ratio and OGTT results were not available in our study. Therefore, the diagnosis of MS according to WHO criteria was limited to the use of BMI >30 kg/m2, impaired fasting glucose (IFG), or type 2 DM based on FG and HbA1c levels only, as shown in Table 1.
IFG was defined as a glucose concentration ≥110 mg/dL (6.1 mmol/L) according to the WHO criteria.4) BMI was calculated by dividing weight in kilograms by the square of height in meters. The study participants were classified into three categories according to their BMI: normal weight (≥24 kg/m2), overweight (>24 and <30 kg/m2), and obese (>30 kg/m2).13) IR was calculated using the Homeostatic Model Assessment for IR (HOMA-IR) and was defined as a HOMA index >2.5.14)
CV risk was calculated using the Framingham Risk Score.15) Patient sex, age, TC level, HDL-C level, use of medication for HT, known vascular disease, DM, systolic blood pressure, and smoking status were used to calculate the risk value of CV. A Framingham Risk Score ≥20% or having a diagnosis of DM was chosen as the threshold for high CV risk.
Statistical Analysis
The results area expressed as mean±standard deviation and parenthetical minimum and maximum values, unless otherwise indicated. The prevalence of various metabolic and CV risk factors for different MS definitions was calculated using 2×2 contingency tables. Logistic regression analysis was performed to determine which MS criteria best predicted CV risk. Sensitivity, specificity, and area under the receiver operating characteristic (ROC) curves were used to evaluate the ability of different MS diagnostic criteria to correctly identify individuals with a high risk of CV. Two-sided p-values <0.05 were considered statistically significant. Statistical analyses were performed using IBM SPSS Statistics for Windows (version 25.0; IBM, Armonk, NY, USA).
Sample Size Calculation
We conducted a post hoc power analysis in G*Power 3.1 to determine whether the study sample size was adequate. With a sample size of 111 for the prediction of CV risk, an effect size of 0.7, and a margin of error of 0.05, the calculated representation power was calculated as 0.96.
RESULTS
This study enrolled 242 patients, including 111 patients treated with LT4 (the LT4 treatment group) and 131 patients without thyroid disease (the control group). The sex distribution did not differ significantly between the LT4 treatment and control groups. Patients in the LT4 treatment group were younger than those in the control group. In addition, the LT4 treatment group had a lower BMI than that in the control group. The anti-TPO antibodies and levothyroxine replacement doses were 370.9±42.8 IU/mL (10–1360) and 68.6±31.8 μg (12.5–200), respectively, in the LT4 treatment group. Forty-eight percent of patients in the LT4 treatment group had thyroid nodules. Thirty-five percent and 28.8% of the LT4 treatment group were on drug treatment for hyperlipidemia and DM, respectively, while nearly half of the participants were on drug treatment for HT (49.5%). The prevalence of CV risk and MS according to the WHO and AACE criteria were similar in both groups (p>0.05). The characteristics of the patients according to the presence of thyroid disease are shown in Table 2.
We classified the LT4 treatment group into two: low CV risk (71 patients, 64%) and high CV risk (40 patients, 36%). The mean age and BMI were similar between the groups (65.7±5.7 vs. 68.7±6.8, p=0.12, and 28±4.4 vs. 29.3±4.9, p=0.365, respectively). As regards laboratory test results, only the mean HbA1c and FG levels were higher in the high CV risk group compared to those in the low CV risk group (p<0.001). A similar situation was observed for the IFG (p<0.001). However, the same relationship was not observed for IR (p>0.05). The diagnosis of MS defined by WHO and AACE was higher in the LT4 treatment group with high CV risk than in those with low CV risk (p<0.001). BMI and TG, the MS criteria that were not included among the CV risk criteria, were not identified as significantly associated with the prediction of CV risk in univariate logistic regression analysis. The characteristics of the LT4 treatment group according to CV risk are shown in Table 3.
All individuals in the LT4 treatment group with MS according to the WHO criteria were also diagnosed with MS, as defined by AACE in the LT4 treatment group. Hypertriglyceridemia and overweight status were extremely common components in both MS criteria, whereas the occurrence of low HDL-C was low in both criteria. HT is more prevalent in patients with MS according to the WHO Health Organization criteria. The prevalence of the MS components is presented in Table 4.
The sensitivity and specificity of the AACE criteria were higher than those of the WHO criteria. The ability of both criteria to identify participants with high CV risk is shown in Table 5.
DISCUSSION
In clinical practice, thyroid dysfunction is common among older individuals. Thyroid metabolism has a bidirectional relationship with metabolic syndrome. However, the prevalence of MS is low among euthyroid patients with or without LT4 treatment. We observed no significant difference in the prevalence of MS and CV risk between the LT4 treatment and control groups. However, the prevalence of MS was significantly higher among individuals with high CV risk in the LT4 treatment group. To predict CV risk, the sensitivity and specificity of the AACE criteria were higher than those of the WHO criteria in the LT4 treatment group.
Hypothyroidism is one of the most significant causes of obesity. However, using LT4 treatment to treat obesity is not recommended in patients without overt hypothyroidism. In addition, LT4 treatment does not have clinical benefits in older persons with subclinical hypothyroidism, and no specific trial in obese older people has yet been performed.16) More than three-quarters of patients in the LT4 treatment group were overweight or obese, although they were receiving adequate LT4 treatment. A recent study reported a lower BMI in obese LT4 users aged >65 years compared to obese LT4 users aged <65 years.17) Thus, age and body composition are the main predictive factors of LT4 requirement in obesity, and the risk of LT4 over-replacement decreases with aging and higher BMI in hypothyroidism.17)
A recent study reported the relationship between subclinical hypothyroidism and the development of MS only in young men.18) Another study including only older people showed the opposite finding and that the prevalence of MS was higher in women with subclinical hypothyroidism compared to that in men.19) Most participants in our study were postmenopausal women. The prevalence of MS may have been high owing to the possible effects of estrogen withdrawal.
Thyroid hormones play an important role in energy homeostasis and glycolipid metabolism. Changes in these hormones are risk factors for CV diseases.20) In our study, half of the LT4 treatment group had IR and nearly one-third had DM. When patients with LT4 treatment were classified into groups according to CV risk status (high or low risk), HbA1c levels and FG levels were higher in the high CV risk group compared to those in the low CV risk group, whereas BMI and HOMA-IR index were similar. HbA1c and FG levels correlated with a higher CV risk in the LT4 treatment group than was the HOMA-IR index. Hypothyroidism is associated with a higher risk of cardiac mortality in the general population.21) Huang et al.22) indicated that older adults with hypothyroidism who used LT4 treatment had a lower CV disease mortality risk than those who did not include patients taking antihypertensive medication LT4 treatment. In this study, no additional evidence on the presence of DM was reported. Mele et al.17) showed that LT4 users in euthyroid obese group had healthier lipid profile than no-users, and they had similar IR and FG to no-users. Thus, despite the CV mortality risk being decreased with LT4 treatment due to its impact on lipid profile, DM still remains a risk factor for CV mortality in patients with hypothyroidism.
Thyroid gland dysfunction contributes to components of MS, including weight gain, lipid disorders, and HT. Among studies that have investigated the relationship between thyroid dysfunction and MS,23-25) most assessed thyroid function in MS26,27) or MS in euthyroid populations or in those with subclinical hypothyroidism.28,29) These studies showed that the presence of MS was associated with a significantly increased risk of developing subclinical hypothyroidism and that individuals with higher TSH levels had an increased risk of MS. However, neither the prevalence of MS nor appropriate MS criteria have been investigated in older patients who are biochemically euthyroid but are receiving LT4 monotherapy. In our study, the prevalence of MS in the LT4 group was similar to that in the control group. The prevalence of MS in the general population varies widely based on ethnicity, sex, age, and presence of comorbidities. Additionally, the prevalence of MS is influenced by the increasing prevalence of obesity, and DM also affects the prevalence of MS. A study that assessed MS in older adults using four criteria—the WHO, US National Cholesterol Education Program Adult Treatment Panel III (NCEP-ATP-III), International Diabetes Federation (IDF), and Joint Interim Statement (JIS) criteria—showed a high prevalence of MS for all definitions.10) A cross-sectional study off 742 individuals aged >20 years in Iran reported that the WHO definition, compared to the AACE, identified more patients with MS (41.8% vs. 30.7%). In addition, neither criterion showed significantly superior diagnostic value for health-related quality of life, although the AACE definition had higher adjusted odds ratios for reporting poor health-related quality of life.30) A cohort study of 1,187 Dutch older persons aged >65 years showed a prevalence of MS of 34.2% using the NCEP-ATP-III criteria. We analyzed the TC/HDL ratio to determine the CV risk and found that TC/HDL ratio increased with higher serum TSH levels.24) Consequently, the prevalence of MS in older individuals and the appropriate criteria for MS in older adults are not clear.
Compared with the WHO criteria, the HDL threshold was higher in the AACE criteria (<40 mg/dL for males and <50 mg/dL for females). HDL cholesterol is known as the cardiac-friendly cholesterol. Therefore, the WHO cut-off (<35 mg/dL for males and <40 mg/dL for females) may underestimate the CV risk in our group of euthyroid patients undergoing LT4 treatment. In addition, the AACE criteria of MS uses a lower BMI threshold than that in the WHO definition. Therefore, compared to the WHO criteria, the AACE one may identify more individuals with increased CV risk. Previous findings showed that the WC/BMI-based definitions of MS were associated with a higher risk of CV compared to IR-based definitions.31-33) In our study, the sensitivity and specificity of the AACE criteria for the prediction of CV risk were higher than those of the WHO criteria.
The prevalence of hypothyroidism is increasing among older patients worldwide. CV risk was further increased in the presence of MS in these patients. The implementation of comprehensive geriatric assessment including the evaluation of MS should be undertaken. The use of BMI for the assessment of MS provides an easy and quick evaluation as it does not require additional measurements. The AACE criteria were superior to the WHO criteria in the prediction of CV risk in older patients undergoing LT4 treatment.
This study had several limitations. First, we retrospectively analyzed only 111 patients with chronic thyroiditis. A randomized controlled trial is needed to assess the relationship between MS and the degree of Framingham CV risk. In addition, we did not consider other MS criteria in the present study as waist circumference data were not available.