The Triglyceride-Glucose Index is Independently Associated with Chronic Kidney Disease in the Geriatric Population, Regardless of Obesity and Sex
Article information

Abstract
Background
Insulin resistance (IR) negatively affects several risk factors of chronic kidney disease (CKD). This cross-sectional study investigated whether the triglyceride-glucose (TyG) index, which reflects IR, was independently associated with CKD in a geriatric population, regardless of obesity and sex.
Methods
The analysis included 7,326 individuals (2,864 males and 4,462 females) aged ≥60 years. Non-obesity or obesity was evaluated using a body mass index cutoff of 25 kg/m2. The TyG index was calculated as ln [triglyceride concentration (mg/dL)×fasting plasma glucose concentration (mg/dL)]/2. All participants were categorized into three groups according to TyG tertiles. Moderate-to-severe CKD (MSCKD) was defined as an estimated glomerular filtration rate (eGFR) of <45.0 mL/min/1.73 m2.
Results
In males and females with or without obesity, a trend test showed a decreasing tendency in the eGFR from the lowest to highest TyG tertiles. Males without obesity and females with obesity in the middle and highest tertiles of the TyG index were 2.342 and 2.393, and were 2.313 and 3.516 times more likely to have MSCKD, respectively. Those with or without obesity in the highest tertile of the TyG index were 1.736 and 2.374 times more likely to have MSCKD, respectively.
Conclusion
Geriatric populations with an increased TyG index have a high risk of MSCKD regardless of obesity and sex. Our findings suggest that increased IR is associated with CKD in the geriatric population independent of obesity and sex.
INTRODUCTION
Chronic kidney disease (CKD) is a common condition in older adults. CKD increases the mortality rate and risk of conditions including myocardial infarction, hypertension, and type 2 diabetes in the geriatric population. From a pathophysiological perspective, these health concerns share a common pathway mediated by insulin resistance (IR).1-3) In 2017, CKD reportedly led to 1.2 million deaths globally. Owing to the aging of the global population, the prevalence and related mortality rate of CKD are expected to rise, with estimated CKD-related deaths increasing to 2.2 million or 4.0 million by 2040 in the best-case or worst-case scenarios, respectively.4) Therefore, developing effective strategies for CKD screening, detection, and management is essential to prevent or suppress the development of severe CKD, particularly in the geriatric population.
The association between obesity and CKD has been globally recognized for decades, and studies have evaluated the risk of CKD by broadly using body mass index (BMI) as the obesity index.5-7) However, Kim et al.8,9) reported that high fat and low muscle mass are more closely related to CKD than BMI-based obesity evaluation. Additionally, the limitation of BMI is apparent in the early screening and detection of high-risk older adults with CKD. The reason for these findings is that BMI does not precisely reflect overall adiposity and does not distinguish visceral fat, which induces the onset of IR.10,11) IR, rather than BMI-based obesity evaluation, is strongly associated with CKD because IR induces CKD risk factors, including glomerular hyperfiltration, sodium retention, defective tubular reabsorption, tissue inflammation, and fibrosis.12-14) Therefore, IR is more likely related to CKD than obesity.
The homeostasis model assessment of insulin resistance (HOMA-IR) has been widely used to examine insulin sensitivity for many years.15) The triglyceride-glucose (TyG) index was strongly related to hyperinsulinemic-euglycemic clamp data collected in Brazil, Mexico, and South Korea.16-18) Additionally, the TyG index is better than the HOMA-IR index for identifying various IR-related health concerns such as arterial stiffness, hypertension, and non-alcoholic steatohepatitis.19-21) Therefore, the TyG index is a reliable and valid indicator of IR that is superior to the HOMA-IR.
We hypothesized that IR is associated with CKD independent of obesity and sex and that an increased TyG index can be used for the early screening and detection of high-risk geriatric populations with CKD. Based on this hypothesis, we conducted a population-based cross-sectional study to examine the association of the TyG index with CKD in the geriatric population, regardless of obesity and sex.
MATERIALS AND METHODS
Study Design and Subjects
We analyzed data from a database of South Koreans’ general health, nutritional status, and lifestyle data from the Korea National Health and Nutritional Examination Survey (KNHANES) 2014–2018. The analysis included 7,326 participants (2,864 men and 4,462 women) among all participants aged ≥60 years from the 2014–2018 KNHANES. Fig. 1 shows a flowchart of participant recruitment. All participants provided written informed consent, and the study was conducted in accordance with the principles of the Declaration of Helsinki and approved by the Institutional Review Board of Silla University (No. 1041449-202203-HR-001).

Flowchart of the subjects. KNHANES, Korea National Health and Nutritional Examination Survey.
This study complied the ethical guidelines for authorship and publishing in the Annals of Geriatric Medicine and Research.22)
TyG Index and eGFR
Blood samples were collected in the morning after a fast of at least 8 hours. Circulating glucose and triglyceride concentrations were measured by enzymatic methods using a Hitachi automatic analyzer 7600 (Hitachi, Tokyo, Japan). The TyG index was calculated as follows.17)
ln [triglyceride concentration (mg/dL)×fasting plasma glucose concentration (mg/dL)]/2.
Creatinine concentrations were analyzed using the Jaffe rate-blanked creatinine assay and compensated at a certified laboratory (Seegene Medical Foundation, Seoul, Korea). The estimated glomerular filtration rate (eGFR) was calculated using the new Japanese-coefficient modified MDRD (Modification of Diet in Renal Disease) study equation as follows.8,9,23-25)
eGFR (mL/min/1.73 m2) = 194 × (serum creatinine)−1.094 × (age)−0.287 (× 0.739 for females).
All participants were assigned into groups according to TyG tertiles. Moderate-to-severe CKD (MSCKD) was defined as an eGFR <45.0 mL/min/1.73 m2.23-25)
Statistical Analysis
All data are shown as mean±standard deviation. Independent t-test or Mann–Whitney U tests were used to compare male and female variables. A one-way analysis of variance (ANOVA) was used to compare the anthropometric and biochemical characteristics of the three TyG index groups. The Bonferroni post-hoc test was applied when ANOVA showed significant differences (p<0.05). The Mann–Whitney U test was used to analyze differences between groups with non-normal data distributions (p<0.05). The Jonckheere–Terpstra test was used to compare the values between the three groups (two-tailed, p<0.05). The Jonckheere–Terpstra test generates standardized statistics (SS) that point to the strength of tendencies in variables that increase or decline across groups.26-28) We applied logistic regression to evaluate the obesity- and sex-specific associations between the TyG index and MSCKD. The fully adjusted model was adjusted for potential confounders such as education level, household income, smoking, drinking, handgrip strength, moderate-to-vigorous physical activity, total energy intake, and BMI, which are recognized or suspected factors associated with CKD. IBM SPSS Statistics for Windows, version 26.0 (IBM Corp., Armonk, NY, USA) was used to perform the statistical analyses. The optimal cutoff values for the TyG index in male and female participants with or without obesity to predict MSCKD were derived from receiver operating characteristic (ROC) curve analysis (area under the ROC curve [AUC] values). The sensitivity and specificity were also calculated. We used MedCalc for Windows version 9.1.0.1 (MedCalc, Ostend, Belgium).
RESULTS
Table 1 presents the participants’ characteristics. The mean age of the participants was 66.1±10.5 years and was significantly higher in male participants than in females (p<0.001). The mean TyG index and eGFR were 8.6±0.6 and 62.8±13.4 mL/min/1.73m2, respectively. The eGFR in male participants was significantly lower than that in females (p<0.001). The TyG index did not differ significantly between the sexes. Supplementary Table S1 provides more information on the subjects.
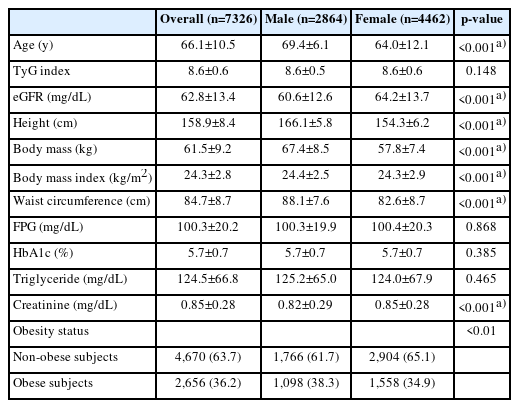
Characteristics of the subjects
Table 2 displays the obesity- and sex-specific differences and tendencies based on the eGFR tertiles in male subjects. In subjects with and without obesity, the tendency test indicated a significant decrease in eGFR from the lowest to highest TyG tertiles (SS -5.61 and -3.59, respectively; both p<0.001). Post hoc testing revealed that the mean eGFR in the lowest tertile was significantly higher than that in the middle and highest tertile. Similar to the male participants, the eGFR values in female participants with and without obesity are shown in Table 3. Supplementary Tables S2 and S3 provide the results of the analyses of additional variables and several covariates for male and female participants, respectively.

Anthropometric data, the TyG index, and eGFR-related biochemical characteristics and trends according to TyG index tertiles in male subjects
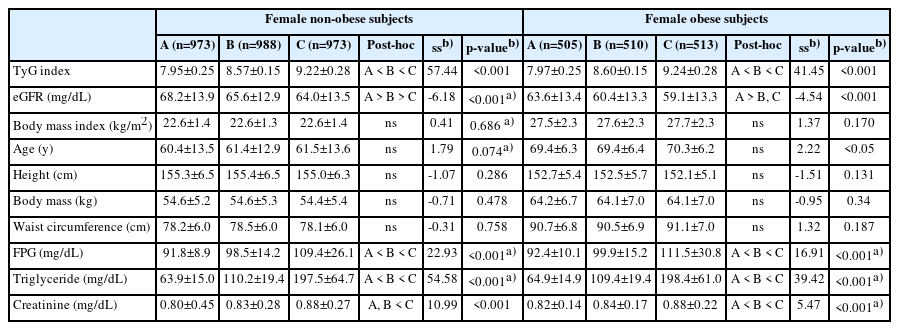
Anthropometric data, the TyG index, and eGFR-related biochemical characteristics and trends according to TyG index tertiles in female subjects
Table 4 compares the obesity- and sex-specific odds ratios for an association between the TyG index and MSCKD. Male and female participants with and without obesity were divided into tertiles based on TyG index values. For male participants without obesity, in the unadjusted model, the middle and highest tertiles displayed odds ratios of 2.392 (95% confidence interval [CI], 1.522–3.760) and 2.439 (95% CI, 1.552–3.835), respectively, compared to the lowest tertile in MSCKD. In the fully adjusted model, the middle and highest tertiles showed odds ratios of 2.342 (95% CI, 1.464–3.747) and 2.393 (95% CI, 1.498–3.823), respectively, relative to the lowest tertile in MSCKD. Regarding female participants without obesity, in the unadjusted model, the highest tertile displayed an odds ratio of 2.123, relative to the lowest tertile (95% CI, 1.411–3.194) in MSCKD. In the fully adjusted model, the highest tertile showed an odds ratio of 2.374 relative to the lowest tertile (95% CI, 1.539–3.662) of MSCKD. Among male subjects with obesity, in the unadjusted model, the highest tertile displayed an odds ratio of 1.620 relative to the lowest tertile (95% CI, 1.016–2.584) for MSCKD. In the fully adjusted model, the highest tertile showed an odds ratio of 1.736 relative to the lowest tertile (95% CI, 1.053–2.863) in MSCKD. Regarding obese female subjects, in the unadjusted model, the middle and highest tertiles had odds ratios of 2.216 (95% CI, 1.361–3.606) and 3.141 (95% CI, 1.975–4.974), respectively, relative to the lowest tertile of MSCKD. In the fully adjusted model, the middle and highest tertiles showed odds ratios of 2.313 (95% CI, 1.397–3.828) and 3.516 (95% CI, 2.164–5.713), respectively, relative to the lowest tertile in MSCKD.
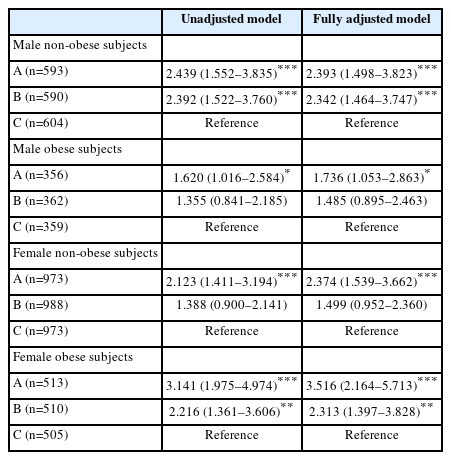
Obesity- and sex-specific odds ratios for the relationship between the triglyceride-glucose index and moderate-to-severe chronic kidney disease
DISCUSSION
This study investigated whether the TyG index, which reflects IR, is associated with CKD in a geriatric population, independent of obesity and sex. The results showed that the TyG index was associated with CKD in the geriatric population, regardless of obesity. Additionally, the relationship between the TyG index and CKD was significant in both male and female participants. These findings suggested that IR is associated with CKD in the geriatric population independent of obesity and sex.
The long-standing consensus is that aging and obesity trigger a decline in kidney function. The effect of aging on CKD is undeniable due to the high global prevalence of CKD in the geriatric population. However, the association between obesity and CKD is increasing, mainly owing to the limitations of BMI. BMI is not an accurate indicator of overall adiposity and visceral fat, which induces the onset of IR.10,11) Recent studies published in 2019, 2020, and 2021 reported that IR was strongly related to a decline in kidney function rather than obesity per se.29-31) Our findings on IR also support these recent reports. In the present study, both male and female participants (Tables 2, 3) showed a stronger decreasing trend in eGFR in subjects without obesity than in those with obesity as the TyG index increased. If obesity causes a decline in kidney function, the decreasing trend in eGFR should be more pronounced in subjects with obesity than in those without. This suggests that the effect of IR on CKD is more significant than that on obesity.
We also found that male participants without obesity in the middle and highest tertiles of the TyG index were 2.342 and 2.393 times more likely to have MSCKD, respectively. Similarly, female participants without obesity in the highest tertile were 2.374 times more likely to develop MSCKD (Table 4). Male participants with obesity in the highest tertile of the TyG index were 1.736 times more likely to develop MSCKD. Additionally, female subjects with obesity in the middle and highest tertiles of the TyG index were 2.313 and 3.516 times more likely to have MSCKD, respectively (Table 4). These findings suggest that increased IR is an independent risk factor for CKD in both men and women, regardless of obesity status. Therefore, IR is a primary pathophysiology that may be independently associated with CKD in geriatric populations regardless of obesity.
Several studies have reported a relationship between IR and CKD.32,33) Animal and human studies have reported that hyperinsulinemia leads to kidney vasodilatation, enhances sodium reabsorption, stimulates the renin-angiotensin system, and causes glomerular hyperfiltration, which increases the GFR.34-36) Increased filtration per nephron causes nephron loss and leads to glomerular hypertension, which causes glomerular sclerosis and a subsequent decline in kidney function.37) In addition, clinical studies have shown pre-existing IR in individuals with a mild decline in kidney function.38,39) The relationship between IR and CKD can be explained via biological mechanisms such as inflammation, oxidative stress, and metabolic acidosis.
Studies have demonstrated the good performance of the TyG index in predicting or discriminating IR-related health concerns. However, specific cutoff values have not been confirmed, and few studies have suggested the potential value of the TyG index. Shin40) studied 4,415 Korean adults aged 20–80 years and showed that a TyG index cutoff value of ≥8.81 discriminated individuals with IR with AUC of 0.894, sensitivity of 86.7%, and specificity of 80.1%. Endukuru et al.41) studied 150 Indian adults aged 18–65 years and found that a TyG index cutoff value for IR of ≥9.88 showed AUC of 0.836, sensitivity of 76.0%, and specificity of 88.0%. The value suggested by Endukuru et al.41) was derived from only 150 adults, and the AUC was relatively low compared with that suggested by Shin.40) In the present study, the potential cutoff value of the TyG index to distinguish individuals with MSCKD, was >8.62 (AUC 0.584; sensitivity 59.34%; specificity 53.26%) (Supplementary Fig. S1). Considering the differences in population age, race, and number, the potential cutoff value in the present study cannot be directly compared with those obtained in the two previous studies. Additionally, the relatively low AUC, sensitivity, and specificity of the potential TyG index cutoff value in the present study suggest the need for re-examination using another sample of the geriatric population. However, as a geriatric population-specific cutoff value to distinguish CKD in high-risk individuals in the early stages, the potential TyG index cutoff value identified in the present study may be appropriate for clinical practice.
Previous studies in the Korean population have provided TyG index cutoff values to discriminate high-risk individuals with several health concerns. Kim et al.27) found that TyG index values of ≥8.72 and 8.67, respectively, were risk factors for sarcopenic obesity in men and women aged ≥60 years with health issues such as hypertension and hyperlipidemia. Kang et al.42) reported a TyG index value of ≥8.83 as a cutoff value for obstructive sleep apnea in men and women with health issues aged ≥55 years. Park et al.43) showed that a TyG index value of ≥8.44 was a cutoff value of coronary artery disease in men and women aged ≥65 years without health issues. Differences in age distribution, inconsistency in sex-specific populations, and differences in basic health status make comparing and determining a precise TyG index cutoff value for all health concerns in the Korean population difficult. However, these reports suggest that late middle-aged and older adults with health issues and a TyG index value of ≥8.6 require careful monitoring to suppress the progression of health concerns. In healthy geriatric populations, a TyG index value of ≥8.44 may be applied as a cutoff for early-stage prevention of health concerns.
The present study had several strengths and limitations. This study’s strength was the adjustment for potential covariates, such as demographic parameters and lifestyle factors that might affect the relationship between the TyG index and CKD. However, the study subjects were older Korean adults; thus, whether the findings of the present study can be applied to other ethnicities or nations is unclear. Further investigations in different races are needed to confirm the association between the TyG index and CKD.
In conclusion, the geriatric population with an increased TyG index has a high risk of CKD regardless of obesity and sex. This finding suggests that increased IR is associated with CKD in the geriatric population independent of obesity and sex.
Acknowledgements
We thank Ellen Knapp, PhD, for editing a draft of this manuscript.
Notes
CONFLICT OF INTEREST
The researchers claim no conflicts of interest.
FUNDING
This study was supported in part by a National Research Foundation of Korea grant funded by the Ministry of Education (No. NRF-2022R1l1A1A01063664) and Grants-in-Aid for Scientific Research from the Ministry of Education, Culture, Sports, Science, and Technology, Japan (No. 21K17450 and 23H03273).
AUTHOR CONTRIBUTIONS
Conceptualization, BK, SO; Data curation, BK, GK; Funding acquisition, BK, NM; Investigation, BK, SO, KH; Methodology, NM, KT; Project administration, BK, KH; Supervision, BK, GK; Writing-original draft, BK; Writing-review & editing, BK, SO.
SUPPLEMENTARY MATERIALS
Supplementary materials can be found via https://doi.org/10.4235/agmr.23.0096.
Characteristics of study subjects
Blood pressure and blood biochemical parameters and trends by TyG Index tertiles in male subjects
Blood pressure and blood biochemical parameters and trends by TyG Index tertiles in female subjects
The receiver operating characteristic curve pertaining to the triglyceride-glucose (TyG) index for moderate-to-severe chronic kidney disease. Dotted line, reference; solid red line, area under the curve (AUC), indicating the accuracy of the TyG index for the identification of moderate-to-severe chronic kidney disease; cutoff value, the value of TyG index that predicts moderate-to-severe chronic kidney disease; sensitivity, the probability of individuals who have moderate-to-severe chronic kidney disease to be predicted to have moderate-to-severe chronic kidney disease; specificity, the probability of individuals who do not have moderate-to-severe chronic kidney disease to be predicted not to have moderate-to-severe chronic kidney disease.