Intermuscular Adipose Tissue: A Brief Review of Etiology, Association With Physical Function and Weight Loss in Older Adults
Article information

Abstract
Adipose tissue redistributes during aging resulting in increased intermuscular adipose tissue (IMAT), intramuscular, and intramyocellular lipid while subcutaneous fat decreases. IMAT has been associated with lower muscle strength, power, and quality, chronic inflammation, impaired glucose tolerance, and elevated total cholesterol in older adults. This review focused on trials investigating the role of age, physical activity and diet on IMAT. The studies agreed that IMAT increases with age and seems to be responsive to physical activity, particularly the combination of aerobic and resistance exercise. However, some reported this could occur with or without weight loss, and some reported that high IMAT at baseline may blunt the muscle quality adaptive response to physical training. Larger and longer trials are needed to differentiate the independent or synergistic effects of resistance and/or aerobic training, and obesity and weight loss combined with resistance, aerobic or combination of aerobic and resistance training on IMAT.
INTRODUCTION
The loss of skeletal muscle mass and function with aging (i.e., sarcopenia) is a well-known biological phenomenon. These losses are accompanied by shifts in adipose tissue and accumulation of fat in other non-adipose depots. The main anatomical depots for adipocytes are subcutaneous fat (SQF), visceral adipose tissue (VAT), intermuscular adipose tissue (IMAT), intramuscular (IMC), intramyocellular lipid (IMCL), and bone marrow.1) This review begins with evidence regarding age-related redistribution of adipose tissue, cellular origins, and physiological consequences of IMAT, and ends with a review of research performed during the past decade that explored the impact of physical activity, weight loss, and obesity on IMAT in older adults.
REDISTRIBUTION OF ADIPOSE TISSUE WITH AGING
Advancing age results in a redistribution of fat, with IMAT, IMC (fat within muscle but between fibers), and IMCL tending to increase, whereas SQF decreases.1,2) The IMAT is located between muscle groups and clearly separated from SQF by well-defined fascia. In contrast, IMC triglycerides accumulate within the muscle cells and are believed to primarily account for IMCL.2) IMAT can be evaluated and quantitated by magnetic resonance imaging (MRI) or computerized tomography (CT), whereas quantification of IMC and IMCL requires proton magnetic resonance spectroscopy (1H-MRS) or lipid histochemistry of muscle biopsy.
CELLULAR ORIGINS OF ADIPOSE TISSUE IN MUSCLE
The cellular origins of adipose accumulation within muscle fibers (intramuscular IMC/IMCL) may arise directly via the accumulation of lipid within myofibers, or intramyocellular lipid.3–5) As with IMAT, the accumulation of IMCL has been associated with insulin insensitivity, inflammation, and skeletal muscle functional deficits.5) The intramuscular lipid pool is both a dynamic fat-storage depot that can expand during periods of elevated lipid availability and a fatty acid source that can be utilized during periods of increased energy expenditure in active individuals.6) Although numerous studies have investigated the lifestyle determinants of IMCL content, the results are far from consistent, and studies attempting to unravel the mechanisms behind IMCL metabolism are in their infancy.7)
It has also been suggested that stem cells of the skeletal muscle may be among the drivers of adipocyte accumulation in ectopic regions. Satellite cells are a well-described stem cell population in skeletal muscle. Another stem cell type has also been described more recently, known as fibro/adipogenic progenitors, or mesenchymal interstitial cells.8–11) These cells, unlike skeletal muscle satellite cells that are resistant to adipogenic differentiation, readily differentiate into adipocytes under conditions of muscle injury or glucocorticoid treatment,8,12) both of which may occur more frequently in middle and older age. Another regulator of adipogenesis is Wnt10b, which has been reported to suppress IMC and increase insulin sensitivity while inhibiting adipogenic differentiation in aged muscle-derived stem cells.13,14) Skeletal muscle also has leptin receptors, and altered leptin signaling can increase both intra- and intermuscular adipose accumulation.15) Paradoxically, caloric restriction that leads to decreasing leptin levels, or even leptin deficiency, results in increased bone marrow adiposity,16,17) while decreasing lipid stores and lipid droplet size in skeletal muscle.18)
PHYSIOLOGIC CONSEQUENCES AND RELATIONSHIP TO PHYSICAL ACTIVITY AND WEIGHT LOSS
Inter- and intramuscular fat mass have been associated with lower muscle strength, power, and quality;19–29) chronic inflammation;30,31) impaired glucose tolerance;23,32) and elevated total cholesterol26,33) in older adults. Despite consistent evidence implicating ectopic adipose tissue in aging-related loss of muscle function, the morphologic and/or molecular mechanisms are yet to be elucidated.
Both intra- and intermuscular fatty infiltration in skeletal muscle decrease sensitivity to insulin, which is required for normal protein synthesis.5) This mechanism may explain why fatty infiltration in and around skeletal muscle is detrimental to muscle mass and strength. In addition, the accumulation of lipid in skeletal muscle with aging or disuse is not identical across different muscle groups and fiber types. Type 1 or slow-twitch fibers accumulate more IMCL lipid with age than do fast-twitch fibers,34,35) and type II or fast-twitch muscle fibers are known to be preferentially lost in the progression of sarcopenia.
A number of trials have investigated the roles of age, physical activity, and diet on IMAT, and a summary of these trials is presented in Table 1. There have been fewer trials investigating the role of intermuscular fat and intermuscular myocellular lipids, and these have primarily focused on obese individuals and younger age groups, men, or athletes. As stated earlier, this area of research is nascent compared to that on IMAT, and thus this short review will focus on studies on the effect of physical activity and/or weight loss or obesity on IMAT in older adults. Studies from the past decade are summarized in Table 1.
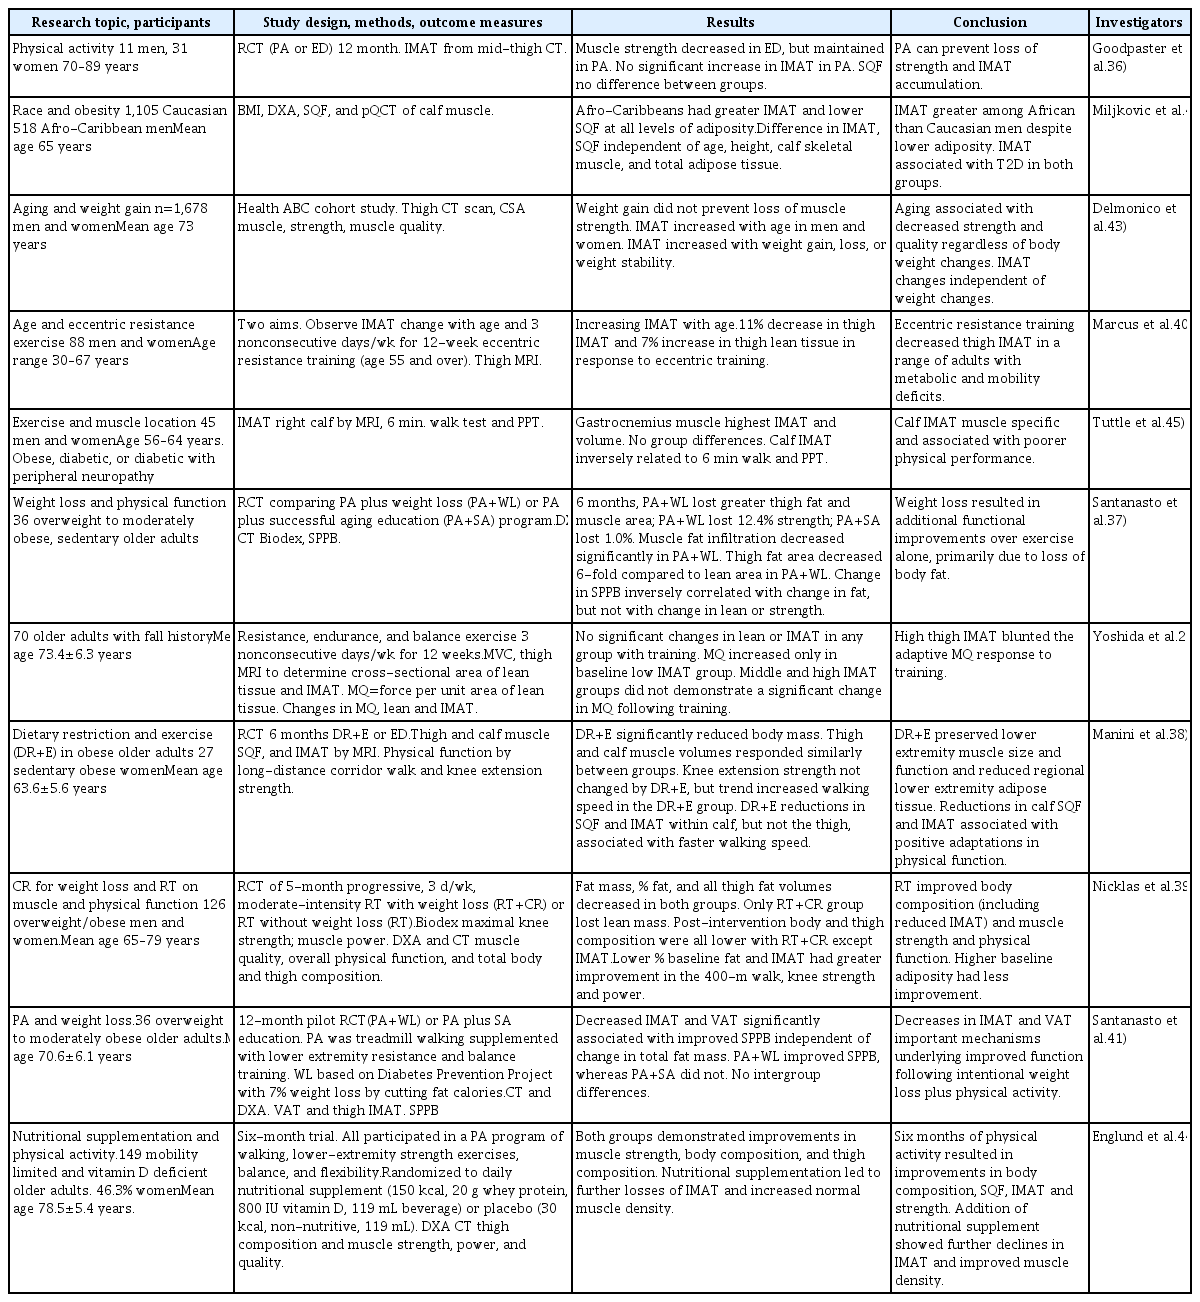
Summary of studies between 2008–2017 on factors affecting IMAT
SUMMARY OF THE REVIEWED STUDIES
To summarize these studies, Goodpaster et al.36) reported that 12 months of physical activity prevented age-related increase in IMAT. Santanasto et al.37) also reported a decrease in IMAT with physical activity combined with weight loss in obese sedentary older adults. Manini et al.38) using a 6-month dietary restriction and physical activity intervention in obese sedentary older women, reported reductions in SAT and IMAT within the calf, but not the thigh, and that these changes were positively associated with faster walking speed. Nicklas et al.39) used 5-month caloric restriction and resistance training (RT+CR) intervention in older obese and overweight men and women. The authors found that post-intervention, body and thigh composition measurements were all lower with RT+CR, except that IMAT did not demonstrate a decrease. However, they found that individuals with lower % baseline fat and IMAT showed greater improvement in the 400-m walk, knee strength, and power. The researchers concluded that the individuals with higher baseline adiposity experienced less overall improvement. Marcus et al.40) also reported no effect of a 12-week, 3 times weekly combined resistance and aerobic plus balance intervention in older adults with a risk of falling. The authors reported that muscle quality only improved in those participants with low IMAT at baseline, and concluded that high IMAT blunts the muscle quality adaptive response to physical training. In contrast, Santanasto et al.41) conducted a pilot randomized controlled trial of physical activity (combined aerobic and resistance training) and weight loss in moderately obese older adults and reported that the decreased IMAT and VAT in response to the intervention was significantly associated with improved Short Physical Performance Battery (SPPB) independent of change in total fat mass. Other authors reported that IMAT was greater among older African than Caucasian men despite lower adiposity, and that IMAT was associated with type 2 diabetes regardless of race.42) Using the Health, Aging, and Body Composition study data, Delmonico et al.43) reported that IMAT increased with age in both men and women but was independent of weight loss, weight gain, or weight stability. More recently, Englund et al.44) reported that 6 months of a physical activity program that included walking, lower extremity resistance exercise, balance, and flexibility in older adults with limited mobility who had vitamin D deficiency resulted in improvements in body composition, SQF, IMAT, and strength. Addition of nutritional supplements resulted in further declines in IMAT.
Other interesting findings include those of Tuttle et al.45) who reported that in obese older adults with diabetes, the gastrocnemius muscle had the highest IMAT, and that this was inversely related to walking and physical performance testing. Finally, Marcus et al.40) conducted a 3 nonconsecutive days/week 12-week eccentric resistance training intervention in a small sample of adults (n=88) with a wide age range (30–67 years). The authors reported that eccentric resistance training decreased IMAT in the thigh in this sample of older adults who had a wide age range, and also had a variety of metabolic and mobility deficits, making interpretation of these results challenging.
CONCLUSION
Studies to date consistently show that IMAT increases with age and appears to be responsive to physical activity, particularly the combination of aerobic and resistance exercise. However, there is less agreement regarding whether this response may occur with or without weight loss. Many of the studies cited in this brief review had small study samples. The two larger trials39,44) in obese and non-obese older adults suggest an effectiveness of physical activity on IMAT, although additional trials are needed to differentiate the independent or synergistic effects of resistance or aerobic training alone or in combination on IMAT, as well as the effects of obesity and weight loss combined with resistance, aerobic, or a combination of aerobic and resistance training. Ongoing clinical trials may provide a greater understanding of the relationships between aging, physical activity, weight loss, physical function, and IMAT.
Notes
The researcher claims no conflicts of interest.