Association of Preoperative Risk Factors and Mortality in Older Patients following Emergency Abdominal Surgery: A Retrospective Cohort Study
Article information

Abstract
Background
Older patients undergoing emergency laparotomy have high morbidity and mortality rates. Preoperative risk assessment with good predictors is an appropriate measure in this population. Frailty status is significantly associated with postoperative outcomes in older adults. This study aimed to investigate the effect of preoperative risk factors and frailty on short-term outcomes following emergency surgery for acute abdomen in older patients.
Methods
This study included older patients (≥65 years of age) who underwent emergency abdominal surgery. We retrospectively analyzed their demographic and clinical variables and used the modified Frailty Index-11 to evaluate their frailty status. The primary outcome was the 30-day mortality rate. We also analyzed risk factors of mortality in these patients.
Results
The study included 150 patients with a median age of 74 years. The mortality rate was 17.3% (n=26). We observed significantly higher mortality rates in patients who were obese and who had higher American Society of Anesthesiology (ASA grades) (p<0.05). Frailty status was worse in deceased group (p<0.001), when compared to individuals who survived. Septic shock was associated with the development of mortality (p<0.001). Multivariate regression analysis revealed that ASA grade was the only independent risk factor for mortality (odds ratio=19.642; 95% confidence interval, 3.886–99.274; p<0.001).
Conclusion
Older patients with obesity and frailty presenting with higher ASA grades and septic shock had the worst survival following emergency abdominal surgery. The ASA grade was an independent risk factor for mortality.
INTRODUCTION
The life expectancy of the older adult population is increasing globally.1) The number of emergency laparotomies performed for geriatric patients increases similar to other surgical procedures in an aging population.2) Although the definition of older adult is controversial, many authors agree on an age over 65 years.3) Patients who undergo emergency laparotomy have high morbidity and mortality rates with additional high risks.4,5) In addition, older patients undergoing abdominal surgery in emergency settings usually require intensive care and longer hospital stays. Therefore, compared to younger patients, it is essential to provide a safe, beneficial, and effective surgical assessment system to evaluate medical risks of consequent illness and clinical competence in older patients.
Chronological age alone may not be a good predictor for poor outcomes in emergency operations of older adults.6,7) Preoperative risk assessment is an appropriate measure for decision-making and preemptive resource allocation.4) Previous studies assessed in detail morbidity and mortality rates in older patients following emergency laparotomy.8-10) Several perioperative risk scoring systems have been developed to assess the outcomes in surgical patients in elective or emergent situations.5) These systems of identifying high-risk patients and providing them with the appropriate level of care include the American Society of Anesthesiology (ASA) grades, Portsmouth Physiological and Operative Severity Score (P-POSSUM) for the enumeration of mortality and morbidity, American College of Surgeons National Surgical Quality Improvement Program (ACS-NSQIP) surgical risk calculator, and National Emergency Laparotomy Audit (NELA) risk prediction calculator.4-6,11-14)
The strengths and weaknesses of these tools have been reported.15) The major criticisms include various parameters that may not be routinely performed and the overestimation of mortality and morbidity.4,6) Moreover, there remains no consensus regarding the reliability of these tools in geriatric populations subjected to emergency laparotomy.16) Because of differences among institutions in their risk prediction of mortality, detailed analyses are needed to determine the reproducibility of the variables used for these tools. Thus, identifying more accurate predictors of mortality in older patients could help identify a surgical assessment tool.11,16)
There is a lack of consensus on the definition of frailty in the literature, and this term has been used subjectively.4,12,17) It often denotes unintentional weight loss, exhaustion, weakness, slow walking, low physical activity, and lack of phenotype.4,18) The Clinical Frailty Scale has been used to apply a more consistent definition.6,17) Because of the lack of a uniform definition and a tool to identify frailty in older patients, several tools have been proposed in different patient groups. Among these, the Clinical Frailty Scale has the advantage of being fast and straightforward to perform.17,18) However, a prospective clinical observation is needed, which includes comorbidities, ability to perform specific activities of daily living, oxygen supplementation, and presence of a terminal illness. The modified Frailty Index-11 (mFI-11) comprises 11 possible comorbidities/deficits that can be recorded retrospectively.6)
As frailty is significantly reportedly associated with 90-day mortality and postoperative morbidity in patients undergoing emergency laparotomy,19) we examined the effect of preoperative frailty on the loss of functional independence following emergency abdominal surgery in older adults.
The present retrospective cohort study aimed to investigate the associations of some preoperative predictive factors, including frailty, with morbidity, mortality, management strategies, and short-term outcomes of emergency surgery for acute abdomen in patients aged 65 years and older.
MATERIAL AND METHODS
Study
This retrospective cohort study included all consecutive older patients who underwent emergency abdominal surgery at Bagcilar Training and Research Hospital in Istanbul, Turkey, between February 2016 and January 2020. The Bagcilar Training and Research Hospital Local Ethics Committee approved the study (No. 2020.10.2.01.162). We conducted this study in accordance with the principles of the Declaration of Helsinki. Written consent could not be obtained due to the retrospective design of the study and the anonymity of the data.
Patients
We retrospectively searched all emergency general surgery admissions using the hospital information system and medical records to include patients aged ≥65 years. We identified a total of 831 patients. The exclusion criteria were age <65 years on the day of surgery (n=647) and incomplete data (n=11). All types of gynecological and urological procedures in non-trauma or trauma surgery settings (n=23) were also excluded. Thus, we evaluated data from 150 admissions.
We collected data on patient characteristics, including demographic data, body mass index (BMI), comorbidities, ASA score, perioperative features, and outcomes. The patients were grouped based on their age (65–74 or ≥75 years). Clinical data, including evidence of sepsis and systemic shock, systolic blood pressure (mmHg), and the lowest or highest values of the laboratory parameters in the initial 24-hour period, were obtained from emergency department records. Comorbidities included diabetes mellitus (DM), hypertension, coronary artery disease (CAD), chronic obstructive pulmonary disease (COPD), and chronic renal failure (CRF). We also recorded perioperative characteristics, diseases requiring surgical treatment, surgical approach, type of surgery, duration, length of intensive care unit (ICU) and hospital stays, postoperative complications, and readmission data.
Frailty status was evaluated using mFI-11. This 11-point scoring system includes 11 possible comorbidities and deficits (Table 1). As a comorbidity-dominant scoring system, it requires binary non-subjective responses. The score can also be calculated without phenotypic measures of the patients, such as exhaustion, slowness, and reduced physical activity.6) Each component is assigned one point with a total point range of 0–11. Frailty status is categorized as frail (score >3 points), pre-frail (1–2 points), and absence of frailty (0 points). For analysis, we grouped the patients as frail (frail and pre-frail) and non-frail.
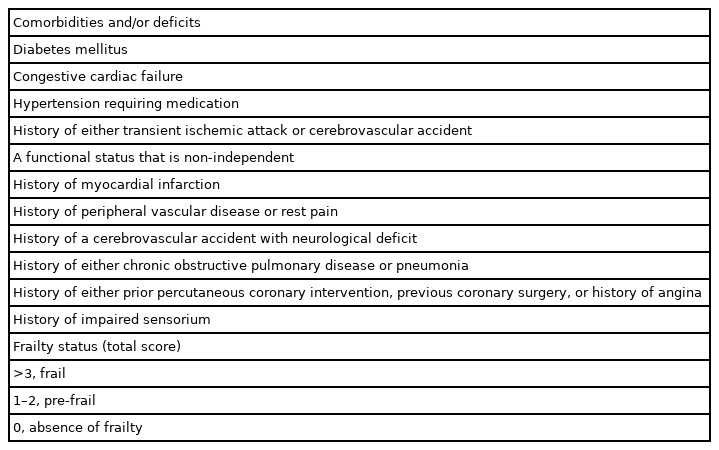
Modified Frailty Index-11 (mFI-11)
Clinical decisions, including the decision to undergo surgery and choice of operative technique (open or laparoscopic), were based on the discretion of the attending consultant surgeons. The surgical procedures were performed by the consultant surgeons or under their supervision.
All patients were followed up to 30 days postoperatively or to death.
Statistical Analyses
The primary outcome was 30-day mortality. We grouped the patients based on the development of mortality (non-survivors and survivors).
We performed statistical analyses using SPSS version 15.0 (SPSS Inc., Chicago, IL, USA). Continuous variables with or without normal distribution are presented as mean±standard deviation and median with interquartile range (IQR, 25% to 75%). Categorical variables are presented as frequencies with percentages. We applied the Kolmogorov-Smirnov test to check the normality of the numerical variables. We used the independent samples t-test to compare two independent groups with normally distributed variables and the Mann-Whitney U test for non-normally distributed variables. We applied Pearson chi-square and Fisher exact tests in 2×2 tables to compare the differences in categorical variables.
Multivariate logistic regression analyses were performed to analyze the factors affecting the development of mortality. Statistically significant factors in the univariate analyses were included in the multivariate analysis. Statistical significance was set at p<0.05.
RESULTS
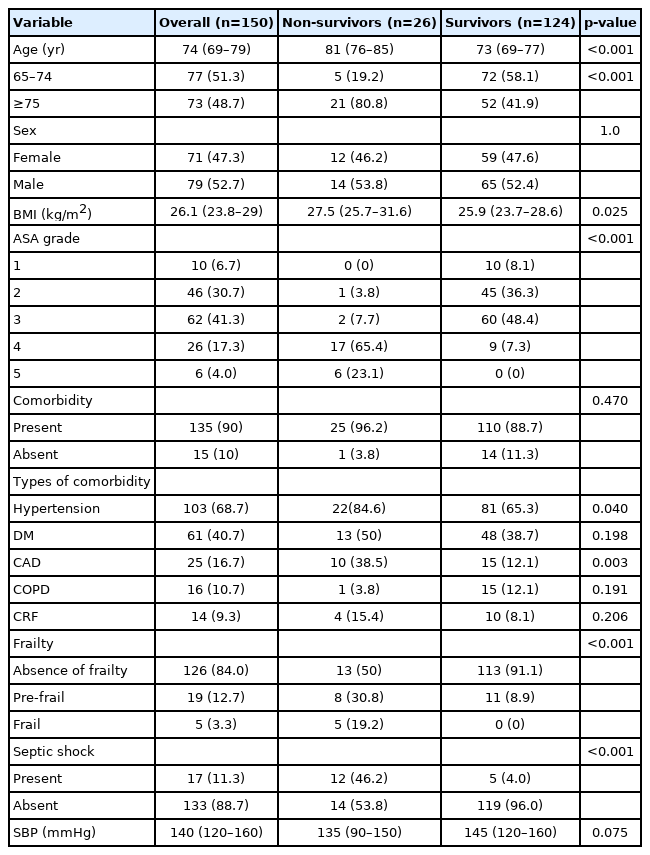
Table 2 presents the details of the patients’ demographic and clinical characteristics. The median age of the 150 patients was 74 years. Of these, 124 patients (82.7%) survived to discharge (survivors), while 26 patients (17.3%) died (non-survivors) within a median length of 3 days (IQR, 2–6).
Demographic and clinical characteristics of the study groups (n=150)
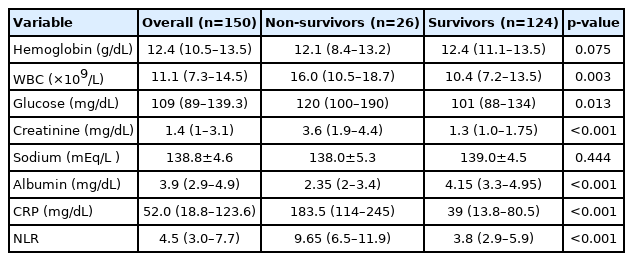
The numbers of female and male patients were similar (71 vs. 79). The mean BMI of the study group was 26.7±4.2 kg/m2. Most of the patients were classified as ASA III (n=62; 41.3%), followed by ASA II (n=46; 30.7%). Most patients (90%) had at least one type of comorbid disease. Hypertension and DM were the two most common coexisting diseases in the study group. Frailty was not observed in 126 patients (84.0%), 19 patients (12.7%) were pre-frail, and five (3.3%) were frail. Seventeen patients (11.3%) experienced septic shock. Table 3 summarizes the laboratory findings of the study groups.
Laboratory features of the study groups (n=150)
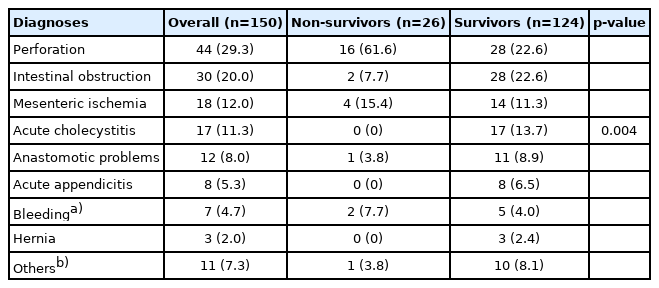
Gastrointestinal perforation was the most common diagnosis in the study group. Forty-four patients (29.3%) had perforation, followed by intestinal obstruction in 30 patients (20.0%). The other diagnoses are listed in Table 4. Intestinal resection with ostomy formation and anastomosis was the most frequently performed surgical procedure in 31 (20.7%) and 22 (14.7%) patients, respectively. The distribution of operations is presented in Table 5.
Distribution of diagnoses in the study groups

Distribution of surgical procedures in the study group
A total of 26 deaths occurred within postoperative 30 days (non-survivors), corresponding to a mortality rate of 17.3%. The median age of the non-survivors was significantly higher than that of the survivors (p<0.001). The rate of patients aged 75 years or more was significantly higher among the non-survivors than in the survivors (80.8% vs. 41.9%) (p<0.001). We observed significantly higher mortality rates in obese older patients with higher ASA grades (Table 3). Hypertension and CAD were more common in non-surviving patients (p=0.040 and p=0.003, respectively). The absence of frailty was more frequently observed in the surviving patients than in non-surviving patients (91.1% vs. 50%; p<0.001). All patients with frailty (n=5) were non-survivors, whereas no patient in the survivor group was categorized as frail. Grouping based on frailty (frail and pre-frail) and the abscence of frailty revealed a significant difference in mortality rates (54.2% vs. 10.3%; p<0.001). In non-survivors, the incidence of septic shock was higher than that in survivors (p<0.001).
Patients with frailty (frail and pre-frail) were likely to be older (p<0.001); have higher ASA grades (p<0.001); and have higher incidences of hypertension (p=0.001), DM (p=0.046), and septic shock (p=0.001). Other demographic and clinical variables were not significantly associated with frailty (p>0.05).
We observed significant differences in laboratory parameters between the two groups (Table 3). Lower albumin values were significantly associated with the development of mortality (p<0.001). Non-survivors had significantly higher white blood cell (WBC) counts and glucose, creatinine, and C-reactive protein (CRP) values (p=0.003, p=0.013, p<0.001, and p<0.001, respectively). The median neutrophil-to-lymphocyte ratio (NLR) values differed significantly between the non-survivor and survivor groups (9.65 vs. 4.8; p<0.001).
We observed significant associations between the diseases requiring surgical treatment and the development of mortality (p=0.004) (Table 4). Perforation was detected in 61.6% of the non-survivors compared to 22.6% of the survivors. No patients with acute cholecystitis or appendicitis died. Intestinal obstruction was more frequently observed in survivors (22.6% vs. 7.7%, respectively). The disease-related mortality rates for perforation, bleeding (intra-abdominal or gastrointestinal), and mesenteric ischemia were 36.4%, 28.6%, and 22.2%, respectively. The distribution of the most frequently performed surgical procedures is presented in Table 5.
The overall morbidity rate was 52%, with a significant difference between groups (100% vs. 41.9%, respectively; p<0.001). The median operation times differed significantly between non-survivors and survivors (118 vs. 85 minutes; p=0.001). Although the length of hospital stay was shorter in non-survivors than in the survivors (p=0.027), the length of the ICU stay was significantly longer in non-survivors (p<0.001).
Overall, 184 complications occurred in 77 patients (51.3%). In other words, 73 patients (48.7%) had no complications. Surgical site infection and renal failure were the most common complications. Cardiac complications were observed only in patients who died. The types of complications are detailed in Table 6.
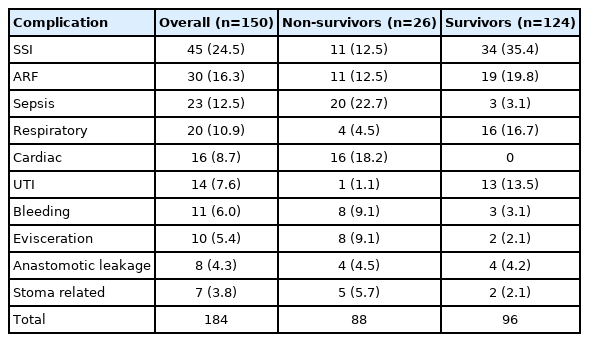
Distribution of complications in the study groups
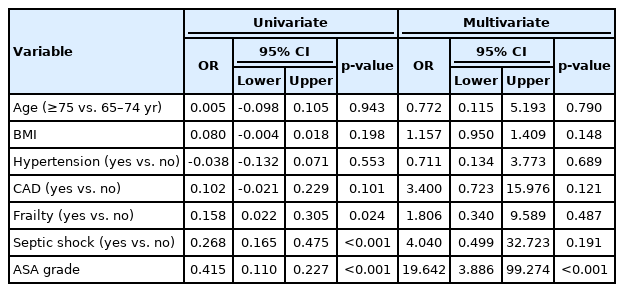
The univariate regression analysis identified frailty status, shock, and ASA grade as significant risk factors for mortality. In the multivariate regression analysis, ASA grade was the only independent risk factor for mortality (odds ratio=19.642; 95% confidence interval, 3.886–99.274; p<0.001) (Table 7).
Results of univariate and multivariate logistic regression analyses for mortality
DISCUSSION
The present retrospective study examined the effect of clinical factors and preoperative frailty on morbidity and mortality following emergency abdominal surgery in older patients. We found that 17.3% of patients died within 30 days of surgery. Older patients who were obese and frail with higher ASA grades were the most vulnerable to mortality following emergency abdominal surgery.
Given the increasing incidence of older patients requiring emergency laparotomy, there is an urgent need for a detailed understanding of the outcomes after this surgery because of the higher risks of mortality.2) Consistent with previous studies,2,10,12,18,19) the most significant predictors for mortality in the present study were age, ASA grade, frailty status, and presence of septic shock. It was not unexpected that these variables were associated with death as they represent the degree of preoperative physiological derangement. Although there are controversial findings regarding the effect of advancing age on mortality, the mortality rates in the present study were higher in older patients aged ≥75 years. Thus, like other investigators,2,3,9,10,20) we recommend considering patient age in the decision-making process for emergency abdominal surgery in older patients.
The results of multivariate regression analysis in the present study identified ASA grade as the only independent risk factor for mortality. Although this finding was contrary to those of other studies in which the ASA grade was not associated with mortality after emergency colectomy,21,22) this may be due to differences in population characteristics. Due to the possible reciprocal relationships between aging and morbidity, it is difficult to determine the specific effect of each factor on mortality. With increasing age, patients are more likely to have comorbidities and experience polypharmacy.19,23) Hypertension and CAD were significant risk factors for the development of mortality in the present study. Therefore, physicians should be aware of the higher risk of adverse events leading to mortality in older patients with hypertension and CAD.
Frailty has been studied as a preoperative risk assessment variable to identify high-risk patients for mortality.3,19,24) Although there is no universal definition of frailty, it may be defined as a phenotype that includes any combination of unintentional weight loss, self-reported exhaustion, grip strength weakness, slow walking speed, and low physical activity.4) However, not all frail patients are old; thus, frailty can be considered a risk factor independent of age.23,24) Different scales or indices have been developed to assess frailty.4,6,17,23) Many of these tools evaluate phenotypic measures such as physical strength, walking speed, activity, nutritional status, and fatigue. The main advantage of the mFI-11 is its comorbidity-dominant scoring system.6) Because of the present study’s retrospective design and unavailability of data to measure these phenotypic measures, we used the mFI-11 to assess frailty status. However, the clinical significance of each system has not been proven satisfactorily, and more research is needed to determine the optimum frailty assessment tool.
Previous studies have reported significant associations between frailty and several outcomes such as mortality, increased risk of complications, and length of hospital stay in older patients undergoing emergency laparotomy.3,17,18) Frailty is also considered an independent risk factor for readmissions and post-discharge deaths. In the present study, frailty was also a significant risk factor for inpatient mortality during the postoperative 30 days. This result may be due to the use of the mFl-11 scale, which is a comorbidity-dominant scoring system.6) The results of the present study showed that higher ASA grades were significantly associated with mortality. Additionally, hypertension and CAD were predictive factors for mortality. Therefore, both the number and severity of comorbid diseases associated with frailty were crucial variables for the development of mortality in this patient group.
Multi-dimensional phenotypic manifestations of frailty, such as physical strength, speed, activity, nutritional status, and fatigue, could be better indicators of the physiological reserve. However, owing to the retrospective design of the present study, it was not possible to collect such data. The most common indication for surgical treatment in the present study was gastrointestinal perforation. Various etiological causes have been attributed to gastrointestinal perforation in different study populations, such as bowel obstruction secondary to cancer or adhesions.19) Although the mortality rates vary based on the diagnoses, peritonitis is generally regarded as the most severe intra-abdominal pathology associated with high mortality rates.19) However, we did not evaluate peritonitis as a separate diagnostic category in this study because there is some degree of subjectivity in grading peritonitis and the condition can result from various etiologies, such as perforation and ischemia.
The major limitation of the present study was that it assessed only 30-day mortality and did not include 90-day mortality. The other limitations were the use of data from a single-center, retrospective design, lack of standardization for postoperative care protocols, and relatively small sample size.
In conclusion, older patients with obesity and frailty with higher ASA grades and septic shock had worse survival following emergency abdominal surgery. Early recognition of these high-risk groups necessitates dedicated and detailed follow-up after emergency abdominal surgery.
Notes
CONFLICT OF INTEREST
The researchers claim no conflicts of interest.
FUNDING
None.
AUTHOR CONTRIBUTION
Conceptualization, NAH, AA; Data curation, YA, SM; Investigation, NAH, YU, MT, GE; Methodology, NAH, YU, MT, GE; Writing-original draft, NAH, TVA, OK; Writing-review & editing, NAH, AA, YU, TVA, SM, MT, OK, GE, YA.