 |
 |
- Search
| Ann Geriatr Med Res > Volume 25(4); 2021 > Article |
|
Abstract
Background
Methods
Results
ACKNOWLEDGMENTS
AUTHOR CONTRIBUTIONS
Conceptualization, GO, EAB, BG, NI, ATI; Data curation, GO, EAB; Funding acquisition, GO, EAB, BG, NI, ATI; Investigation, GO, EAB, BG; Methodology, GO, EAB, BG, NI, ATI; Project administration, GO, NI, ATI; Supervision, NI, ATI; Writing-original draft, GO, EAB, BG; Writing-review & editing, GO, EAB, BG, NI, ATI.
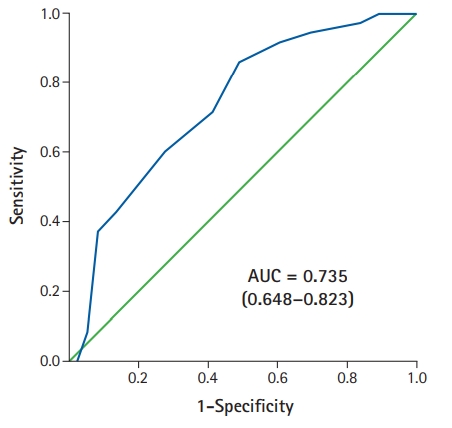
Fig.┬Ā2.

Table┬Ā1.
| All participants (n=166) | Frail group (TFI Ōēź 8) (n=57) | Non-frail group (TFI < 8) (n=109) | p-value | |
|---|---|---|---|---|
| Demographic characteristics | ||||
| ŌĆāAge (y) | 72.96┬▒6.41 | 73.10┬▒6.54 | 72.89┬▒6.36 | 0.84 |
| ŌĆāSex, female | 112 (67.5) | 48 (84.2) | 64 (58.7) | <0.01* |
| ŌĆāBMI (kg/m2) | 28.57┬▒5.22 | 29.54┬▒5.63 | 28.06┬▒4.95 | 0.08 |
| ŌĆāEducation (y) | 7.42┬▒4.92 | 5.33┬▒4.60 | 8.53┬▒4.74 | <0.01* |
| ŌĆāNumber of medications | 5.04┬▒2.87 | 6.05┬▒3.13 | 4.51┬▒2.59 | <0.01* |
| ŌĆāFalls | 54 (32.5) | 25 (43.9) | 29 (26.6) | 0.03* |
| ŌĆāMMSE score | 26.49┬▒3.69 | 26.13┬▒3.80 | 26.72┬▒3.62 | 0.45 |
| Laboratory values | ||||
| ŌĆāHemoglobin (g/dL) | 12.77┬▒1.28 | 12.39┬▒1.17 | 12.97┬▒1.30 | <0.01* |
| ŌĆāCRP | 4.50┬▒7.36 | 4.95┬▒8.67 | 4.19┬▒6.34 | 0.36 |
| ŌĆāAlbumin | 4.14┬▒0.33 | 4.08┬▒0.35 | 4.17┬▒0.31 | 0.16 |
| ŌĆāFolic acid | 9.89┬▒4.47 | 9.50┬▒5.08 | 10.10┬▒4.11 | 0.12 |
| ŌĆāVitamin D (ng/mL) | 24.13┬▒10.96 | 21.68┬▒9.33 | 25.48┬▒11.58 | 0.03* |
| ŌĆāVitamin B12 (pg/mL) | 389.32┬▒246.09 | 335.38┬▒190.76 | 418.10┬▒267.44 | 0.04* |
| ŌĆāBlood Glucose (mg/dL) | 111.39┬▒40.26 | 119.14┬▒53.35 | 107.26┬▒30.64 | 0.12 |
| ŌĆāTSH (mLU/L) | 1.80┬▒1.54 | 1.96┬▒1.79 | 1.72┬▒1.39 | 0.33 |
| Comorbidities | ||||
| ŌĆāCerebrovascular disease | 8 (4.8) | 4 (7.0) | 4 (3.7) | 0.44 |
| ŌĆāDiabetes mellitus | 55 (33.1) | 20 (35.1) | 35 (32.1) | 0.73 |
| ŌĆāHypertension | 109 (65.7) | 38 (66.7) | 71 (65.1) | 0.86 |
| ŌĆāHyperlipidemia | 44 (26.5) | 19 (33.3) | 25 (22.9) | 0.19 |
| ŌĆāCongestive cardiac failure | 8 (4.8) | 4 (7.0) | 4 (3.7) | 0.44 |
| ŌĆāCOPD | 17 (10.2) | 5 (8.8) | 12 (11.0) | 0.79 |
| ŌĆāDementia | 18 (10.8) | 6 (10.5) | 12 (11.0) | 0.92 |
| ŌĆāSarcopenia | 15 (9.0) | 6 (10.5) | 9 (8.3) | 0.62 |
| Comprehensive geriatric assessment | ||||
| ŌĆāFried frailty score | 1.56┬▒1.30 | 2.15┬▒1.41 | 1.24┬▒1.12 | <0.01* |
| ŌĆāFried frailty states | 0.01* | |||
| ŌĆāŌĆāNo abnormalities | 37 (22.3) | 7 (12.3) | 30 (27.5) | |
| ŌĆāŌĆāPre-frail | 94 (56.6) | 29 (50.9) | 65 (59.6) | |
| ŌĆāŌĆāFrail | 35 (21.1) | 21 (36.8) | 14 (12.8) | |
| ŌĆāPOMA total score | 25.68┬▒3.44 | 24.26┬▒3.96 | 26.42┬▒2.88 | <0.01* |
| ŌĆāPOMA balance score | 14.55┬▒2.15 | 13.61┬▒2,5 | 15.05┬▒1.75 | <0.01* |
| ŌĆāPOMA gait score | 11.13┬▒1.51 | 10.65┬▒1.70 | 11.39┬▒1.34 | <0.01* |
| ŌĆāIADL score | 19.59┬▒4.59 | 18.42┬▒5.31 | 20.20┬▒4.06 | 0.01* |
| ŌĆāBADL score | 92.78┬▒8.41 | 89.16┬▒10.82 | 94.68┬▒6.07 | <0.01* |
| ŌĆāGDS score | 3.32┬▒3.63 | 5.91┬▒3.9 | 2.04┬▒2.63 | <0.01* |
| ŌĆāHADS-A score | 6.66┬▒4.77 | 9.52┬▒4.28 | 5.16┬▒4.32 | <0.01* |
| ŌĆāMNA score | 12.84┬▒1.56 | 12.16┬▒1.78 | 13.19┬▒1.30 | <0.01* |
| ŌĆāHandgrip strength (kg) | 19.37┬▒9.46 | 15.37┬▒8.64 | 22.95┬▒9.37 | <0.01* |
| ŌĆāLow muscle strength | 76 (45.8) | 33 (57.9) | 43 (39.4) | <0.01* |
| ŌĆāSMM (kg) | 18.69┬▒4.53 | 17.14┬▒3.62 | 19.50┬▒4.76 | <0.01* |
| ŌĆāSMI (kg/m2) | 7.45┬▒1.31 | 7.15┬▒1.23 | 7.60┬▒1.32 | 0.03* |
| ŌĆāLow muscle quantity | 27 (16.3) | 9 (15.8) | 18 (16.5) | 0.90 |
| ŌĆāGait speed (m/s) | 1.00┬▒0.34 | 0.85┬▒032 | 1.08┬▒0.32 | <0.01* |
| ŌĆāLow physical performance | 48 (28.9) | 26 (45.6) | 22 (20.2) | <0.01* |
| ŌĆāBMR (kcal) | 1,408.96┬▒215.13 | 1,360.87┬▒210.27 | 1,434.11┬▒214.30 | 0.03* |
Values are expressed as mean (standard deviation) for continuous variables and percent was reported for categorical variables.
BMI, body mass index; MMSE, Mini-Mental State Examination; TSH, thyroid-stimulating hormone; COPD, chronic obstructive pulmonary disease; TFI, Tilburg Frailty Indicator; POMA, Performance-Oriented Movement Association; BADL, basic activities of daily living; IADL, instrumental activities of daily living; CDR, Clinical Dementia Rating Score; GDS, Geriatric Depression Scale; HADS-A, Hospital Anxiety and Depression Scale-Anxiety; MNA, Mini Nutritional Assessment; SMM, skeletal muscle mass; SMI, skeletal muscle mass index; BMR, basal metabolic rate.
Table┬Ā2.
| Variable |
TFI score Ōēź 8 (frail) |
Fried score Ōēź 3 (frail) |
||||||
|---|---|---|---|---|---|---|---|---|
| B | SE | p-value | OR (95% CI) | B | SE | p-value | OR (95% CI) | |
| POMA total | -0.15 | 0.06 | 0.01* | 0.85 (0.75ŌĆō0.96) | -0.18 | 0.06 | <0.01* | 0.82 (0.72ŌĆō0.94) |
| POMA gait | -0.21 | 0.12 | 0.09 | 0.80 (0.62ŌĆō1.03) | -0.18 | 0.13 | 0.15 | 0.83 (0.64ŌĆō1.07) |
| POMA balance | -0.30 | 0.11 | <0.01* | 0.73 (0.59ŌĆō0.91) | -0.41 | 0.11 | <0.01* | 0.66 (0.52ŌĆō0.83) |
| Walking speed | -1.41 | 0.73 | 0.05 | 0.24 (0.05ŌĆō1.02) | -5.82 | 1.30 | <0.01* | 0.01 (0.01ŌĆō0.03) |
| BADL | -0.08 | 0.02 | <0.01* | 0.91 (0.86ŌĆō0.96) | -0.08 | 0.03 | <0.01* | 0.91 (0.86ŌĆō0.97) |
| HADS-A | 0.19 | 0.04 | <0.01* | 1.21 (1.11ŌĆō 1.33) | 0.06 | 0.04 | 0.18 | 1.06 (0.97ŌĆō1.16) |
| GDS | 0.30 | 0.07 | <0.01* | 1.35 (1.17ŌĆō1.56) | 0.13 | 0.06 | 0.05 | 1.13 (1.00ŌĆō1.29) |
| IADL | -0.06 | 0.04 | 0.14 | 0.93 (0.85ŌĆō1.02) | -0.15 | 0.05 | <0.01* | 0.85 (0.77ŌĆō0.95) |
| MNA | -0.40 | 0.12 | <0.01* | 0.66 (0.52ŌĆō0.85) | -0.34 | 0.13 | 0.01* | 0.70 (0.54ŌĆō0.92) |
| Low MS | 1.10 | 0.41 | <0.01* | 3.03 (1.35ŌĆō6.78) | 1.39 | 0.46 | <0.01* | 4.03 (1.61ŌĆō10.10) |
| Low SM | 0.21 | 0.51 | 0.67 | 1.24 (0.45ŌĆō3.42) | -0.60 | 0.60 | 0.31 | 0.54 (0.16ŌĆō1.79) |
| Sarcopenia | 0.34 | 0.64 | 0.58 | 1.41 (0.40ŌĆō5.00) | 0.22 | 0.67 | 0.74 | 1.25 (0.33ŌĆō4.68) |
TFI, Tilburg Frailty Indicator; GDS, Geriatric Depression Scale; POMA, Performance-Oriented Movement Association; BADL, basic activities of daily living; HADS-A, Hospital Anxiety and Depression Scale-Anxiety; MS, muscle strength; SM, skeletal muscle; SE, standard error; OR, odds ratio; CI, confidence interval.
REFERENCES
- TOOLS


