Comparison of Human Interpretation and a Rule-Based Algorithm for Instrumented Sit-to-Stand Test
Article information
Abstract
Background
The five times sit-to-stand test (5STS) is one of the most commonly used tests to assess the physical performance of lower extremities. This study assessed the correlation between human interpretation (5STShuman) and a rule-based algorithm (5STSrule) using instrumented 5STS with two sensors.
Methods
We analyzed clinical records of 148 patients who visited the geriatric outpatient clinic of Asan Medical Center between December 2020 and March 2021 and underwent physical performance assessment using the electronic Short Physical Performance Battery (eSPPB) protocol. For STS, time-weight and time-distance curves were constructed using a loadcell and light detection and ranging (LiDAR). We manually assessed the grids of these curves to calculate 5STShuman, while 5STSrule used an empirical rule-based algorithm.
Results
In the study population, the mean 5STShuman and 5STSrule times, i.e., 12.2±0.4 and 11.4±0.4 seconds, respectively, did not differ significantly (p=0.232). Linear regression analysis showed that 5STShuman and 5STSrule were positively correlated (β=0.99, R2=0.99). The measures also did not differ (p=0.381) in classifying sarcopenia according to the Asian Working Group Society criteria, with C-indices of 0.826 for 5STShuman and 0.820 for 5STSrule.
Conclusion
An empirical rule-based algorithm correlated with human-interpreted 5STS and had comparable classification ability for sarcopenia.
INTRODUCTION
Accumulating evidence suggests the clinical importance of assessing the physical performance of the lower extremities in older adults as a diagnostic marker,1-3) outcome predictor,4-6) and clinical outcome measure.7-9) For example, the assessment of the physical performance of the lower extremities is an essential component in diagnosing sarcopenia, a common geriatric syndrome defined as a state of decreased muscle mass, muscle strength, and/or physical performance.2,10) Longitudinal studies have shown that decreased physical performance of the lower extremities is associated with falls, functional decline, and mortality.11-15) Furthermore, meaningful changes in physical performance following treatment are considered crucial efficacy measures in intervention studies targeting sarcopenia or frailty.16,17)
Among the various tools used to assess the physical performance of lower extremities, the five times sit-to-stand test (5STS) is one of the most commonly used tests owing to its advantages in clinical implementation.18) The test can be performed in clinical environments with restricted time and space.19) 5STS is included in the consensus definition for sarcopenia, either as a separate test (≥12 seconds for impaired physical performance) or as a component of the Short Physical Performance Battery (SPPB) score (with scores ≤9 indicating impaired physical performance).2) While most studies have adopted 5STS using a simple chair and stopwatch, researchers have also developed instrumented approaches using sensors of varying modalities to automatically or semi-automatically acquire 5STS measurements to minimize inter-rater variability and collect additional information during test protocols.18-21)
We previously developed a multi-sensor kiosk to semi-automatically perform SPPB using light detection and ranging (LiDAR) and loadcells to facilitate physical performance assessments in both clinical and research settings.21) Electronic SPPB (eSPPB) was comparable to SPPB performed manually by a single experienced examiner.21) In addition, continuous parameters derived from eSPPB were used to classify frailty in geriatric outpatients.22) The eSPPB protocol used two sensors, i.e., a loadcell and LiDAR, as well as a rule-based algorithm, to determine the sit and stand maneuvers.21) Although the correlation between the instrumented 5STS in eSPPB and manual 5STS was assessed semi-quantitatively (score ranging from 0 to 4), the validity of the rule-based algorithm has not yet been proven.
Hence, we assessed the correlation between human interpretation (5STShuman) and the rule-based algorithm (5STSrule) to determine instrumented 5STS time in geriatric outpatients at a tertiary academic hospital. We also compared the characteristics of these two 5STS measurement methods in classifying sarcopenia.
MATERIALS AND METHODS
Study Design and Participants
This study was performed as a retrospective cross-sectional review of clinical records of 165 consecutive outpatients who visited the geriatric outpatient clinic of Asan Medical Center between December 2020 and March 2021 and underwent physical performance examination, including the eSPPB protocol. Community-dwelling and ambulatory patients with or without a walking aid were considered for the test because eSPPB involves gait speed measurement. When performing eSPPB, patients with an estimated life expectancy of less than 1 year owing to advanced malignancy or those with decompensated heart failure or end-stage renal disease, those unable to walk without other persons’ assistance, or those with cognitive dysfunction who could not perform eSPPB according to instructions were excluded. We also removed 17 duplicate records of patients who underwent eSPPB more than once and included 148 records in our final analysis. Among the study population, 5STS and sarcopenia were analyzed in 126 patients who underwent geriatric assessments, including demographic, medical, and sarcopenia parameters.
The protocol for this study was reviewed and approved by the Institutional Review Board of the Asan Medical Center (No. 2021-0519). Because of the retrospective nature of the study, the requirement for informed consent was waived. We maintained the confidentiality of patients’ health information and performed our analysis after anonymizing the dataset. In this study, the researchers complied with the ethical rules for human experimentation stated in the Declaration of Helsinki.23)
Measurement of 5STS
Test protocol and sensor composition
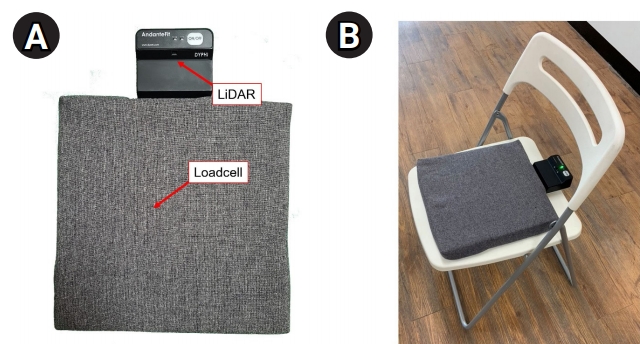
For 5STS, the patients were instructed to perform five sit-to-stand maneuvers as quickly as possible, with their arms crossed on the shoulders of the opposite side. To acquire 5STS data, we combined two sensors to simultaneously measure the seated weight and position of participants in real time (Fig. 1). First, a loadcell measured the weights of the sitting participants every 10 ms and produced a time-weight curve. Second, a LiDAR sensor measured the distance from the corner of the chair to the buttock of participants to produce a time-distance curve. These sensors were connected to a computer using the XBee wireless protocol (Digi International Inc., Hopkins, MN, USA) and controlled by a software that performed the standardized eSPPB protocol (Dyphi Inc., Daejeon, Korea).14,21) For the categorization of 5STS, we employed the widely used criterion for SPPB, ranging from 0 to 4 (0 for 5STS >60 seconds, 1 for 16.7–60 seconds, 2 for 13.7–16.7 seconds, 3 for 11.2–13.7 seconds, and 4 for ≤11.2 seconds).
5STShuman
Graphs of the time-weight curve and time-distance curve were interpreted by HWJ who was blinded to demographic and clinical parameters of the participants. For interpretation, 200-ms vertical grids were introduced in the graphs to determine the time points of (1) the buttock of participants detached from the chair as the starting point and (2) participants completed five chair stands as the finish point (Fig. 2) to best mimic eye observed 5STS. The duration between the start and finish points (5STShuman) was calculated.
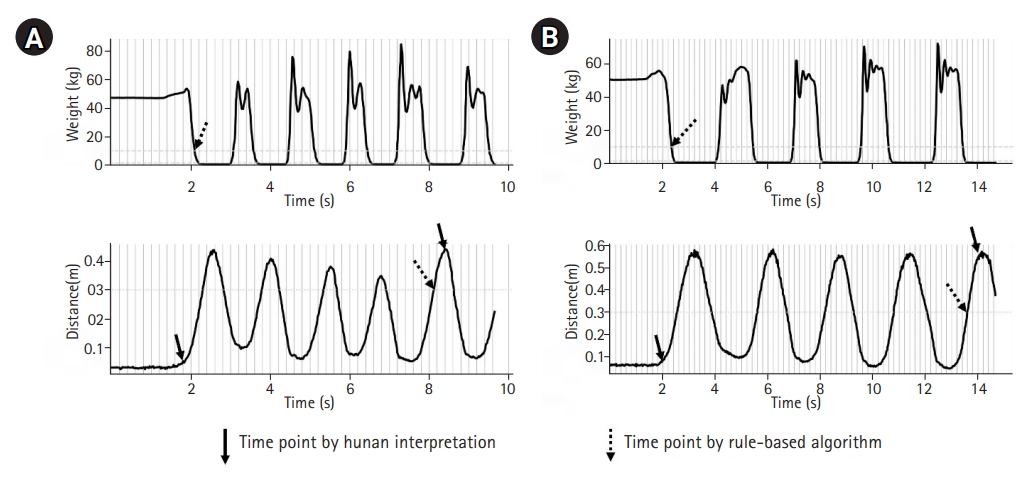
Two examples of sit-to-stand tests. (A) A patient with 5STShuman and 5STSrule times of 6.4 seconds and 6.0 seconds, respectively. (B) A patient with 5STShuman and 5STSrule times of 11.2 seconds and 11.3 seconds, respectively. 5STShuman, human-interpreted five times sit-to-stand test time; 5STSrule, rule-based five times sit-to-stand test.
5STSrule
For 5STSrule, we used both time-weight and time-distance curves to define four conceptual phases of 5STS: (1) sit, weight ≥10 kg; (2) sit-to-stand, weight <10 kg and distance <30 cm; (3) stand, weight <1.5 kg and distance >30 cm; and (4) stand-to-sit, weight ≥1.5 kg. The cut-off values for weight and distance were established empirically. Based on these rules, the starting point of the test was defined as an initial seated weight decrement of <10 kg, while the ending point of the test was indicated by the fifth increment of distance exceeding 30 cm (Fig. 2).
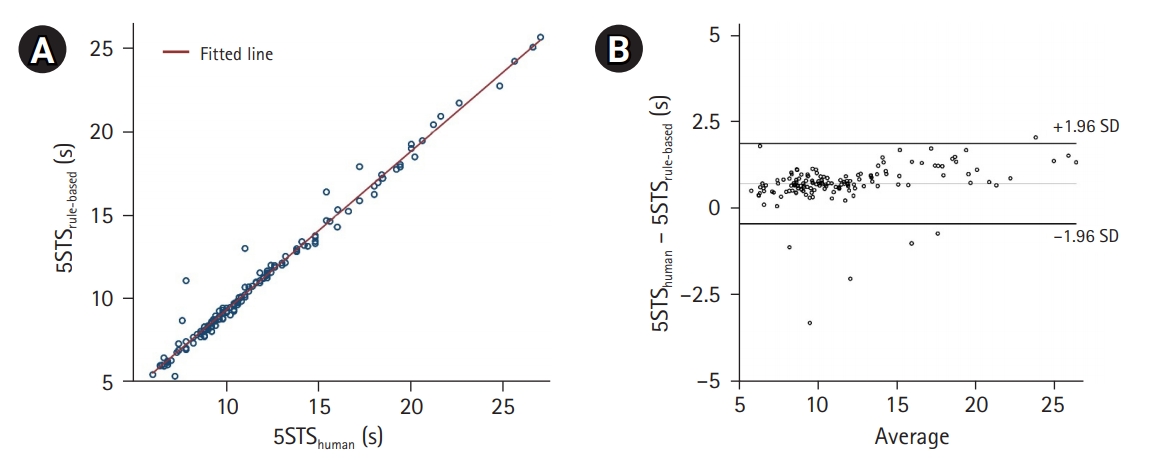
(A) Scatterplot showing 5STShuman and 5STSrule times and their correlations according to a fitted line. (B) Bland-Altman plot of 5STShuman and 5STSrule times. 5STShuman, human-interpreted five times sit-to-stand test time; 5STSrule, rule-based five times sit-to-stand test.
Sarcopenia Assessments
Muscle mass was assessed using bioelectrical impedance analysis (InBody S10; InBody, Seoul, Korea). Appendicular skeletal muscle (ASM) was estimated by summing the muscle masses of the four extremities. ASM was divided by height2 (m2) to calculate the skeletal muscle mass index (SMI) to adjust for anthropometric differences among patients. Grip strength of the dominant hand was measured using a JAMAR hydraulic handgrip dynamometer (Patterson Medical, Warrenville, IL, USA) with the elbow flexed at 90° and the participant in a seated position. For walking speed, we measured the 4-m usual gait speed, with a separate 1-m acceleration distance that was excluded from the speed calculation.24)
Sarcopenia was determined according to the 2019 Asian Working Group for Sarcopenia (AWGS) guidelines, in which individuals with low muscle mass (SMI <7.0 kg/m2 for men and <5.7 kg/m2 for women), low muscle strength (grip strength <28 kg for men and <18 kg for women), or low physical performance (gait speed <1.0 m/s) were considered as having sarcopenia.
Statistical Analysis
Descriptive statistics were analyzed for demographic and geriatric parameters of the study population. T-tests and chi-square tests were used to compare continuous and categorical variables, respectively. We assessed the intraclass correlation coefficient (ICC) between 5STShuman and 5STSrule and used a scatterplot with linear regression analysis to assess the correlation between 5STShuman and 5STSrule. Bland-Altman plots and linear regression analysis of the means and differences were used to evaluate the potential biases between these two measures, with the absolute difference as a dependent variable and the average as an independent variable.25) The kappa statistic was calculated to assess the agreement between categorized 5STShuman and 5STSrule scores. The performance of 5STShuman and 5STSrule in classifying sarcopenia was assessed by receiver operating characteristic (ROC) analysis and comparisons of C-indices. Two-sided p-values <0.05 were considered statistically significant. Analyses were performed using Stata 16.0 (StataCorp, College Station, TX, USA).
RESULTS
Basic Characteristics
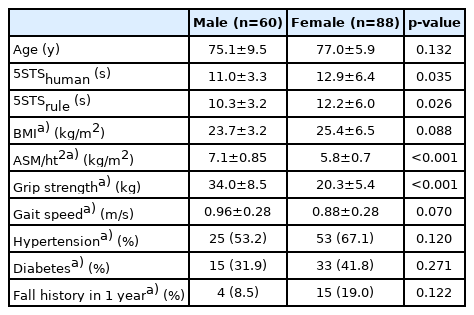
In the study population, the mean age was 76.3±7.6 years, and 88 outpatients (59.5%) were female (Table 1). The 5STShuman time was significantly shorter (p=0.035) in men (11.0±3.3 seconds) than in women (12.9±6.4 seconds). Similarly, the 5STSrule time was significantly shorter (p=0.026) in men (10.3±3.2 seconds) than in women (12.2±6.0 seconds). Age was positively correlated with both 5STShuman (standardized beta [β]=0.30, p<0.001) and 5STSrule (β=0.29, p<0.001). The worst quintile values of 5STShuman and 5STSrule were 14.8 and 13.7 seconds, respectively.
Agreements between 5STShuman and 5STSrule
The absolute difference between STS by 5STShuman (12.2±0.4 seconds) and 5STSrule (11.4±0.4 seconds) was 0.74±0.62 seconds, and it did not differ significantly (p=0.232). The correlations between these two parameters are shown in Fig. 1. Linear regression analysis showed that 5STShuman and 5STSrule were positively correlated (β=0.99, R2=0.99, p<0.001, 5STShuman=1.05×5STSrule+0.18). The ICC of the average measures between 5STShuman and 5STSrule was 0.98 (p<0.001). A proportional bias between 5STShuman and 5STSrule was observed using linear regression (Fig. 3, β=0.45, R2=0.19, p<0.001).
Since 5STS is commonly performed as a component of SPPB, we compared the categorical scores between 5STShuman and 5STSrule (Table 2). The kappa statistic between the two measures was 0.88, suggesting a substantial agreement.
Performance of Classifying Sarcopenia
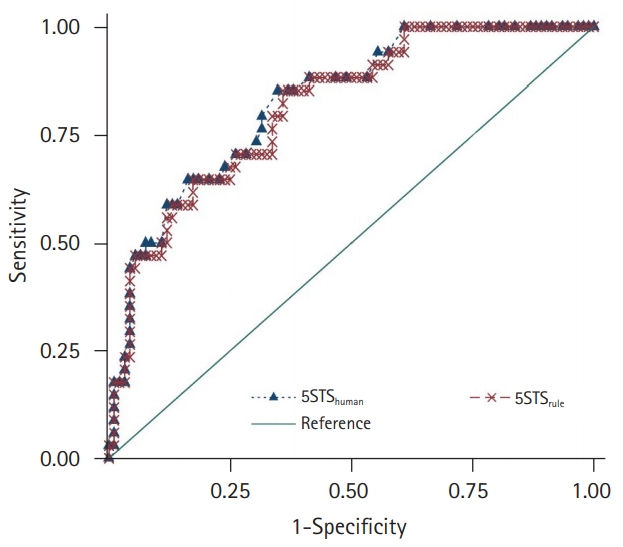
Among 126 patients who underwent assessments for sarcopenia, 34 (27.0%) met the AWGS criteria for sarcopenia. Specifically, 58 (46.0%) had low muscle mass, 42 (33.3%) had low gait speed, and 33 (26.2%) had low grip strength. In ROC analysis (Fig. 4), the C-indices for classifying sarcopenia according to the AWGS criteria from 5STShuman and 5STSrule were 0.826 (95% confidence interval [CI], 0.749–0.903) and 0.820 (95% CI, 0.743–0.897), respectively, showing no statistically significant difference (p=0.381). The cut-off times with maximal sensitivity+specificity for sarcopenia were ≥13.8 seconds for 5STShuman and ≥12.8 seconds for 5STSrule.
DISCUSSION
The results of this study demonstrated the correlation between 5STShuman and 5STSrule from instrumented STS. Moreover, the two approaches showed similar abilities in detecting sarcopenia. While the mean difference between 5STShuman and 5STSrule was not significant in the study population, 5STSrule tended to be smaller than 5STShuman, with intrinsic characteristics of empirically determined rule-based criteria defining the phase shift between the sit-to-stand and standing states, in contrast to human interpretation, which tried to capture the maximal peak of the distance between the LiDAR sensor and patients. To our knowledge, this study is the first attempt to adopt a type of sensor fusion method using both LiDAR and loadcells to assess 5STS.
Previous studies have attempted to capture the dynamics of 5STS using different sensors such as accelerometers, motion capture devices, force plates, depth cameras, and RGB cameras.18-20,26-29) Shukla et al.19) showed that a force plate or loadcell-embedded seat could more accurately capture 5STS than depth or RGB cameras, with a smaller mean error size compared to a human expert examiner. In the study,19) the results of the phase-determination rule-based algorithm interpreting the time-weight curve of a loadcell-embedded chair were generally similar, although researchers adopted a percent cut-off value to define phases rather than the absolute weight value as used in the present study. Although a single loadcell sensor could reliably measure STS, as demonstrated by Shukla et al.19), we noted that rule-based algorithms based on loadcell data were sometimes less reliable in capturing STS phases, especially in frail and underweight female patients in real-world settings. To address this issue, we added a LiDAR set at 45° to further acquire time-distance data by tracking the distance between the sensor and buttock of the participants. In contrast to non-wearable sensor approaches, studies have also adopted wearable sensors.26,27) However, these studies generally focused on exploring new features to assess fall risk rather than measuring 5STS per se.
We observed that the rule-based interpretation provided more rapid 5STS, with an absolute difference of 0.7 seconds, compared to that for 5STShuman. A previous report showed a minimally detectable 5STS difference of 2.5 seconds;30) thus, the difference between 5STShuman and 5STSrule is less likely to affect the interpretation of the physical performance of patients in clinical assessments. Our observation of agreement between the categorized scores of 5STShuman and 5STSrule further supports the comparability of these two approaches. However, to alleviate possible concerns regarding differences owing to the slightly biased interpretation of 5STSrule, regression equation between 5STShuman and 5STSrule can be performed to calculate the estimated 5STShuman using the automatically measured 5STSrule.
Although we used an empirically established rule-based algorithm in the current study, there is still room for improvement in optimally mimicking 5STShuman. Given sufficient data from patients with a wide spectrum of physical performance and expert annotation on time-weight and time-distance curves, machine learning can be used to develop better algorithms. With the development of improved algorithms, instrumented 5STS can be more confidently adopted both as a screening tool and as an outcome measure with minimal inter-rater variability for intervention schemes targeting sarcopenia.
The strengths of this study are the implementation of sensors and algorithms for real-world geriatric outpatients and the clinical assessments of sarcopenia. While eSPPB using these sensors has been in clinical use since 2019, raw weight-time and distance-time data other than the eSPPB score were not stored in the hardware until a software update in December 2020 while the updated software allowed the current post-hoc analysis for 5STS using stored raw eSPPB data. Similar to a previous study using continuous parameters of eSPPB for classifying frailty,22) explorations of human kinetic features with newer algorithms using already installed sensors may identify additional physical biomarkers related to sarcopenia and frailty.
The present study had some limitations. Most importantly, STS was performed only using the instrument while manually measured 5STS using the human eye and stopwatch was not available since the study was a retrospective analysis using stored eSPPB data. However, as previously demonstrated,19) 5STS by human observation is unlikely to affect the results of the current study. In addition, as a single-center study in a tertiary academic hospital in Korea, the generalizability of the results is limited. The statistical significance of the absolute difference between 5STShuman and 5STSrule cannot be ruled out if the study was performed with sufficiently large sample size. To address these issues, future studies with larger populations of diverse ethnicities are warranted.
In conclusion, 5STShuman and 5STSrule times using a LiDAR and loadcell were correlated in older geriatric outpatients. Both measures agreed with the categorical scores of the SPPB and had comparable classification ability for sarcopenia. Our findings support clinical evidence for adopting instrumented 5STS in clinical practice and research for older adults.
Notes
CONFLICT OF INTEREST
Hee-Won Jung, Seongjun Yoon, and Hyunchul Roh cofounded Dyphi Inc., a startup company on sensor technology. The other researchers claim no conflicts of interest.
FUNDING
This research was supported by a grant from the Korea Health Technology R&D Project through the Korea Health Industry Development Institute (KHIDI) funded by the Ministry of Health & Welfare, Republic of Korea (No. HI18C2383). The sponsor played no role in any part of this study, including the design, methods, recruitment, data collection, analysis, and manuscript preparation.
AUTHOR CONTRIBUTIONS
Conceptualization, HWJ, SY, HR; Data curation, HWJ, SY, IYJ, HR; Funding acquisition, IYJ; Investigation, HWJ, SY, HR; Methodology, HWJ, SY, IYJ, HR; Writing-original draft, HWJ; Writing-review & editing, all.

