Trajectories of Body Mass Index and Their Associations with Mortality among Older Adults in Korea: Analysis of the Korean Longitudinal Study of Aging
Article information

Abstract
Background
Weight change is a known risk factor for mortality. Previous Korean studies only considered mortality consequences of weight change between two time points over relatively short periods. This study investigated whether body mass index (BMI) trajectory patterns were associated with all cause-mortality based on continuous BMI observations during a 10-year follow-up period among Korean older adults.
Method
This study analyzed data from the 2006–2016 Korean Longitudinal Study of Aging database. The participants included in this study were 3,478 people aged 65 years or older who had no previous cancer history. A trajectory model was developed to classify different homogeneous trajectory subgroups according to BMI, and Cox proportional hazards models were used to investigate the association of BMI trajectory with all-cause mortality.
Result
We identified four trajectory groups: obese (OG); overweight (OWG); high normal weight (HNWG); and low normal weight (LNWG). The LNWG and HNWG experienced continuous weight loss during the study period. Trajectories with higher BMI were associated with lower mortality. The adjusted hazard ratios (95% confidence intervals) for all-cause mortality in the LNWG, HNWG, and OWG were 2.40 (1.69–3.40), 1.75 (1.26–2.45), and 1.38 (0.99–1.96), respectively, compared with those in the OG.
Conclusion
We found that the lower the BMI of the weight trajectory group, the higher the mortality over 10 years in Korean older adults. This result suggested that baseline obesity status and degree of weight loss during follow-up contributed to mortality in later life.
INTRODUCTION
Weight change is an important risk factor for mortality. The association of weight change with mortality is frequently shown as a reverse J-shaped curve.1,2) Weight loss in overweight or obese people and weight gain in underweight people have beneficial effects on health.1) However studies have reported conflicting results depending on ethnicity and age groups. While some studies reported that weight loss and weight gain increased mortality,3,4) others found no associations.5)
Instead of using baseline body mass index (BMI) as in previous studies,6,7) some studies used body weight change as a predictor of mortality in Korea.1,8) Thus, weight status changes throughout a lifetime should be considered.9,10) However, most studies have focused only on the mortality consequences of weight (or BMI) changes between two time points during the study period.1,8) Because there is a limit to defining an individual’s subgroup based on short-term weight or BMI changes, this approach obscures heterogeneity in weight changes that occur after the second time point, as well as weight fluctuations.11) In particular, the dynamic measures of BMI may better predict mortality in older adults.11,12)
Several studies have performed repeated observations of weight at regular intervals over a period longer than 10 years to evaluate the associations between weight changes and mortality in older adults. However, the study using data from the Health and Retirement Study by Zheng et al.11) included a relatively young population with mostly white ethnicity. Many non-western societies have varying distributions of body weight from the United States;13) thus, studies of older Asian adults are needed.
Therefore, this study followed up BMI changes over 10 years among community-dwelling Korean adults aged 65 years or older and investigated the effects of these changes on mortality using data from the Korean Longitudinal Study of Aging (KLoSA). A trajectory model was developed to classify different subgroups according to BMI.
MATERIALS AND METHODS
Data and Study Sample
The KLoSA is a nationwide longitudinal panel survey of 10,254 randomly sampled Koreans aged 45 years or older (born before 1961), excluding residents of Jeju Island. Since 2006, a biennial basic survey has been conducted, with a total of six follow-up surveys completed by the time of the present study. The sample retention rate of the existing panel showed a stable trend of 78% as of the 6th follow-up survey, with a total of 6,618 valid samples available for analysis.
The questionnaire used in this study was conducted using computer-assisted personal interviewing, a computer-based interpersonal interview method. The survey comprised a wide range of questions, including those on household background, human attributes, family, health, employment, income and consumption, assets, subjective expectations, and quality of life. The KLoSA also includes data on deaths. Since 2008, deaths have been reported at 2-year intervals, with data collected on the date, cause, and place of death and the medical history of the dead. The information related to the death was obtained by asking family members about their pre-death situation. All participants provided written informed consent, and the survey protocol was approved by the Institudinal Review Board of Wonkwang University Sanbon Medical Center (No. WMCSB 202006-42).
After excluding individuals aged under 65 years, a total of 4,164 individuals remained. We further excluded individuals with only one BMI measurement during follow-up (n=663) and those with errors in the dataset (n=23). Finally, 3,478 participants aged 65 years or older, comprising 1,467 men (42.2%) and 2,011 women (57.8%), were included in the analysis of the association between BMI and all-cause mortality (Fig. 1).

Flow chart of study population selection. BMI, body mass index.
Measurements
The covariates in this study can be broadly divided into sociodemographic factors, behavioral factors, and factors related to the current health status of the participants. The sociodemographic and behavioral factors included age, sex, marital status, educational level, smoking and drinking history, and regular exercise. Regular exercise was defined as at least one exercise per week, while others classified as “non-exercise”. Smokers were classified into non-smokers, former smokers, and current smokers. Former smokers were defined as people who had not smoking at present but had experienced smoking more than five packs (100 cigarettes) in total. Participants who had smoked less or had not smoked in the past were considered “non-smokers”. Drinkers were divided into non-drinkers and current drinkers, with those who drink sometimes or frequently or those who had drunk recently classified as “current drinkers”. Others, including former drinkers, were classified as “non-drinkers”.
Health status was assessed based on chronic disease status, self-rated health, and functional status. The six chronic diseases included in this study were hypertension (HTN), diabetes mellitus (DM), chronic lung disease, chronic liver disease, heart disease, and stroke. Self-rated health was classified into five categories—namely, 1 (very good), 2 (good), 3 (normal), 4 (bad), and 5 (very bad)—as described in the Survey of Health, Ageing and Retirement in Europe (SHARE) study, and they were reclassified into good, moderate, and bad in the present study. The functional status of the participants was assessed based on activities of daily living (ADL) values. ADL was scored based on whether a person requires assistance to perform activities, including dressing, washing/brushing, bathing/showering, eating, leaving the room, using the toilet, and controlling the stool. The value was “1” for participants requiring partial or full help with the activity and “0” if they did not require help. All values were summed and indexed.
Handgrip strength was measured as part of the physical function measurement. The grip strength of both hands was measured twice using a dynamometer (Hand Grip Meter Blue 6103; Tanita Co., Tokyo, Japan) and expressed as the total mean value of the grip strength values for the left and right hands. The 10-item Centre for Epidemiological Studies Depression Scale (CES-D10) and Korean version of Mini-Mental State Examination (K-MMSE) were used to assess the mental and cognitive status of the participants. In the depression scale, the questionnaire was assigned a value of “1” or “0”, and all values were summed.
This study analyzed four BMI trajectory subgroups. BMI is expressed as the ratio of the weight in kilograms to the square of height in meters. We used the classifications from the 2018 guidelines of the Korean Society for the Study of Obesity,14) in which BMI of 25 kg/m2 or higher is categorized as obesity, 23–24.9 kg/m2 as pre-obesity (overweight or risk weight), 18.5–22.9 kg/m2 as normal weight, and less than 18.5 kg/m2 as underweight.
Statistical Analysis
Analysis of covariance and χ2 tests were used to assess baseline characteristics of each trajectory group for continuous and categorical variables, respectively. Values are expressed as mean±standard deviation or as percentages.
All participants were divided into trajectory subgroups using the Traj command in STATA, which is based on the group-based trajectory modeling method proposed by Nagin15) and employs a two-stage model selection process. The number of trajectory groups was determined in the first stage, while the best polynomial trajectory function was determined and the Bayesian Information Criteria (BIC) value was calculated in the second stage. As recommended, the best-fitting model was chosen based on BIC scores and an examination of 95% confidence interval (CI).16) This approach allowed us to derive a relatively homogeneous cluster of four groups. To evaluate trajectory model fit, we used the average group posterior probability (AvePP), odds of correct classification (OCC), difference between estimated group probabilities (π), and proportion P assigned to the group using the maximum probability rule. When a model fit the data well, these these π and P values were similar.
We used Cox proportional hazards models to calculate the relative mortality risk for each trajectory. The proportional hazards assumption was tested using a non-zero slope in a generalized linear regression of the scaled Schoenfeld residuals on time. The assumption was tested using the estat phtest command in STATA (p=0.88).
Participants with more than one BMI measurement were included in the trajectory group analysis to avoid a reduction in power. Traj assumes a missing-at-random mechanism, and no imputation was made in trajectory modeling.
For participants satisfying the inclusion criteria, a complex sample file was constructed by applying weights to the sample, and a complex Cox regression analysis was then performed. We designed two additional Cox proportional hazards regression models to adjust for various confounding factors. Model 1 was adjusted for age, sex, chronic diseases (HTN, DM, cancer, chronic lung disease, chronic liver disease, heart disease, stroke), and self-rated health. Model 2 was adjusted for the same variables as Model 1 plus the level of education, marital state, smoking, alcohol, regular exercise, handgrip strength, ADL, MMSE, and depression. The results were expressed as hazard ratio (HR) with 95% CI. All analyses were conducted using STATA (Stata/MP 13.1 for Windows). p-values less than 0.05 were considered statistically significant.
RESULTS
Trajectory Model Development
The participants were divided into four trajectory groups according to the degree of BMI. The four-group model was refined to achieve the lowest absolute BIC value.12) While the five-group model had the lowest BIC value, the sample sizes in each group were small (<5%). Subject-specific judgment combined with BIC has been suggested to determine the number of groups. Together with other criteria such as reasonable sample size for each group membership (e.g., reasonably large group size >5%),11) we identified four distinct trajectories, namely the low normal weight, decreasing trajectory group (LNWG: baseline BMI, 19.4±1.92 kg/m2; linear slope, -0.15; 95% CI, -0.19 to -0.12); high normal weight, decreasing trajectory group (HNWG: baseline BMI, 22.0±1.64 kg/m2; linear slope, -0.01; 95% CI, -0.12 to -0.08); overweight, stable trajectory group (OWG: baseline BMI, 24.5±1.72 kg/m2; linear slope, -0.05; 95% CI, -0.03 to 0.02); and obesity, stable trajectory group (OG: baseline BMI, 28.1±2.16 kg/m2; linear slope, -0.05; 95% CI, -0.10 to 0.01). BMI decreased over time in the LNWG and HNWG but did not change in the OWG and OG. The BIC value for this model was -36552.88 and had the best fit among all other four-group models (Supplementary Table S1). BMI was measured as a mean of 4.78 times among participants during the six survey waves. The response rates of BMI at baseline and 2nd waves were 96.6%, and 95.2%, respectively, and they deceased in the following waves at 89.7% (3rd wave), 87.1% (4th wave), 87.9% (5th wave), and 87.4% (6th wave).
Evaluation of the Model Fit
The model fit was evaluated using several diagnostics as suggested by Nagin.15) For all four trajectory groups, the lowest average posterior probability was 0.91, far greater than the recommended value of 0.7. This means that the model assigned participants to different trajectory groups with little ambiguity. Furthermore, the lowest OCC value was 13.4, which is also greater than the recommendation of 5 as a general guideline.15) In addition, the probability of group membership (π) and the proportion assigned to each group using the maximum probability rule (P) were almost identical for each group. This indicates that the model assigned participants to different trajectory groups with high certainty (Supplementary Table S2).
Demographic and Comorbidity Characteristics of the Trajectory Groups
The baseline characteristics of the four trajectory subgroups are shown in Table 1. The proportions of participants in the four trajectory groups were 19.0%, 41.5%, 31.0%, and 8.5% in the LNWG, HNWG, OWG, and OG, respectively. The higher the group’s mean BMI, the lower the mean age (p<0.001) and the higher the proportion of women (p<0.001). Participants in groups with a higher mean BMI tended to exercise more regularly and were more likely to be current smokers (p<0.001), and their prevalence of DM and HTN was higher (p<0.001). In addition, the MMSE score was significantly higher with increasing mean BMI.
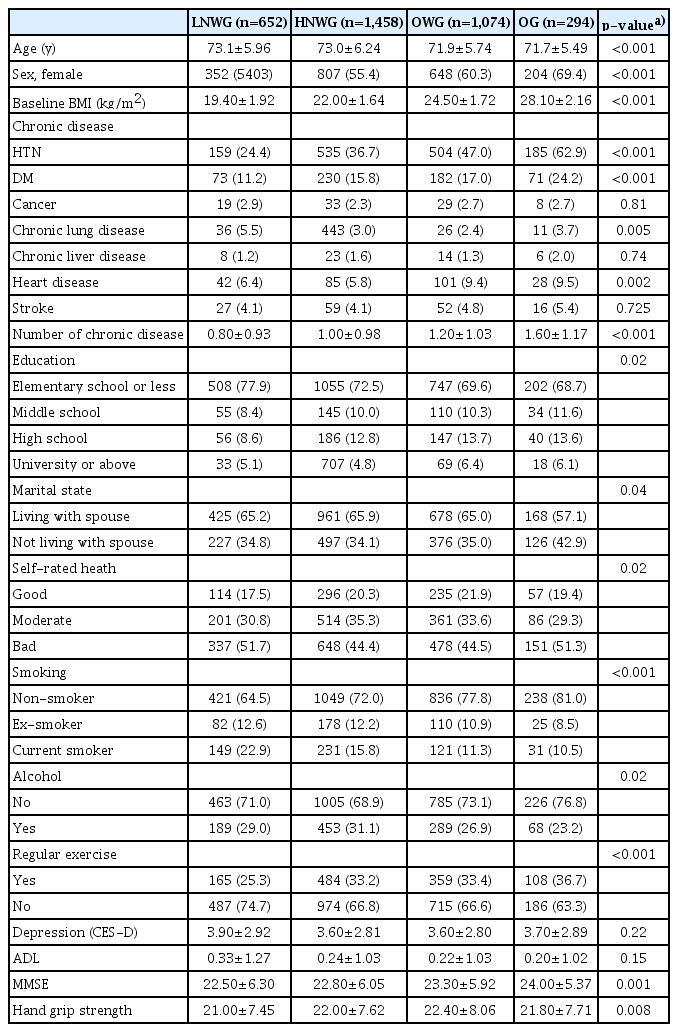
Participant characteristics of according to BMI trajectory
Fig. 2 shows the changes in BMI with age for each trajectory group. Almost 60% of the participants were within the normal weight range at baseline. The LNWG lost weight to almost underweight levels during the 10-year follow-up period, while the other groups showed weight changes within their original category. The overweight and obesity groups remained within the same BMI categories.
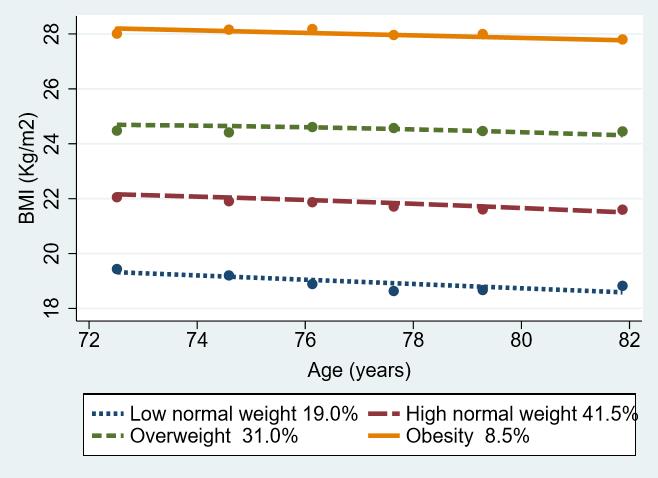
Body mass index (BMI) trajectories of the participants during study period. BMI decreased with age in the low normal weight and high normal weight groups, but it was stable in the overweight and obesity groups.
Cox Proportional Hazard Ratio of All-Cause Mortality according to BMI Trajectories in Participants
Table 2 shows the Cox proportional hazard ratios of all-cause mortalities among groups, with the trajectory of the OG set as the reference. The participants were adjusted for confounding variables (age, sex, chronic disease, self-rated health, level of education, marital state, smoking, alcohol, regular exercise, handgrip strength, ADL, MMSE, and depression). As shown in Table 2, the other three trajectories are associated with an excess risk of death compared to the OG. The crude HRs (95% CI) of the LNWG and HNWG compared with those of the OG were 2.61 (1.92–3.57) and 1.96 (1.46–2.66), respectively, while the adjusted ratios were 2.40 (1.69–3.40) and 1.75 (1.26–2.45), respectively. Among the confounding variables analyzed in Model 2, the variables related to mortality were age, sex (male), DM, chronic lung disease, stroke, and smoking. In addition, the results confirmed that the lower the individual’s MMSE score, the lower the cognitive function and the higher the probability of death.
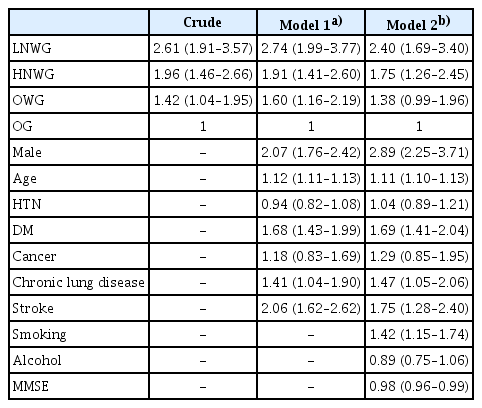
Cox proportional hazard ratio of all-cause mortality according to BMI trajectories in participants
The Kaplan–Meier survival curves presented in Fig. 3 show a better overall survival probability in the group with higher BMI. While the obesity and overweight group initially showed similar survival rates, the gap gradually increased over time.
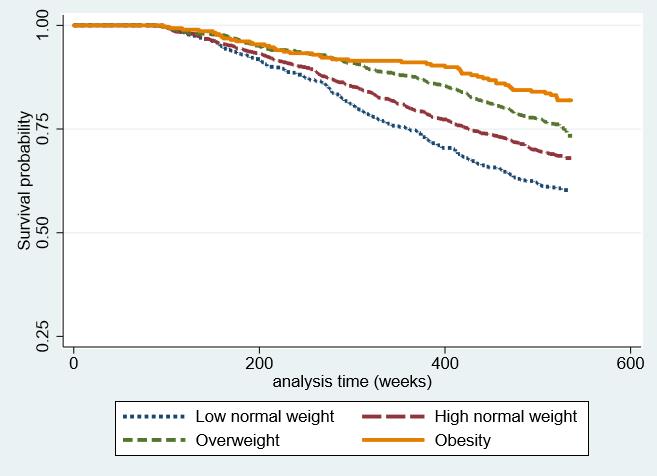
Kaplan-Meier survival curves stratified by body mass index (BMI) for all participants. As a result, overall survival probability is better in groups with higher BMI.
Subgroup and Sensitivity Analyses
After stratifying participants with respect to sex, we selected separate four-group trajectory models in men and women using the same method described above (Supplementary Fig. S1). After adjusting for confounding variables, the HRs (95% CI) of mortality in the LNWG, HNWG, and OWG compared with those in the OG were 1.91 (1.01–3.98), 1.60 (0.90–2.87) and 1.35 (0.79–2.32), respectively, in men and 2.99 (1.44–6.24), 1.92 (1.04–3.54) and 1.40 (0.81–2.42), respectively, in women (Supplementary Tables S3, S4, and Fig. S2).
Compared with participants included in the analysis, those excluded during enrollment or who dropped out during the study period were older, less obese, likely to be living alone, more depressed, showed more cognitive decline, had more chronic diseases, and had lower handgrip strength (Supplementary Table S5).
participants who died or were censored during the study period tended to be older and current smokers and have more morbidity (more chronic diseases, more depressed, lower ADL, MMSE, and handgrip strength) compared with those who survived (Supplementary Table S5).
To reduce potential causation bias between weight loss and mortality such as smoking, cancer, and cardiovascular disease (CVD), we performed sensitivity analyses, excluding smokers and those with cancer and CVD. The weight loss patterns and HRs of each weight group in the sensitivity analyses were similar to the main results. The respective adjusted HRs (95% CI) of mortality in the LNWG, HNWG, and OWG compared with those in the OG were 2.39 (1.57–3.64), 1.86 (1.26–3.64), and 1.32 (0.88–1.98), respectively, in non-smokers; 2.41 (1.69–3.43), 1.71 (1.23–2.40), and 1.32 (0.93-1.87), respectively, in the no-cancer group; and 2.14 (1.49–3.08), 1.63 (1.15–2.29), and 1.26 (0.88–1.81), respectively, in the no-CVD group (Supplementary Table S6).
DISCUSSION
This is the first study to identify the heterogeneity of BMI trajectories and demonstrate its association with mortality in the older population in Korea. The participants were classified into obesity, overweight, high-normal, and low-normal groups, all of which showed a slight decrease in BMI over a 10-year period. BMI decreased with age in the LNWG and HNWG but was stable in the OWG and OG. Of the four trajectory groups, the group with higher BMI was younger, had better cognition, and exercised regularly compared with the group with lower BMI. However, the group with a lower BMI had a relatively lower prevalence of HTN and DM and included more male and current smokers. As shown in Model 2 (Table 2), after adjusting for confounding variables, the group with lower BMI had a consistently higher risk of all-cause mortality.
A meta-analysis of prospective studies reported that weight loss was related to an increased risk of all-cause mortality in middle-aged populations.17) However, as the relationship between body weight and mortality appears to vary by age,18) it is important to investigate whether the association between weight change and mortality persists in older populations.
Many studies have reported the association between BMI and mortality in Korea.1,6-8) Several large cohort studies have been conducted based on baseline BMI in patients aged over 65 years receiving regular health checkups.6,7) These studies reported higher mortality risks in the group with lower baseline BMI. Park et al.8) investigated the association of BMI change with mortality in addition to baseline BMI. Their subgroup analysis showed that BMI change better predicted mortality than a single measure. Using the National Health Insurance System health checkup data, Kim et al.1) reported the association between weight change and subsequent mortality, demonstrating a reverse J-shaped all-cause mortality curve for weight change; furthermore, weight loss was associated with a higher risk of mortality than was weight gain. However, these studies measured BMI just twice (at baseline and later) in a short period and included a relatively young population. In contrast, the current study attempted to classify BMI subgroups by repetitive measurement of BMI through long-term follow-up and by using a trajectory model.
Several studies have explored the relationship between BMI trajectories and mortality. Using data from the Health and Retirement Study for older Americans, Zheng et al.11) defined six linear trajectories (overweight stable, normal weight downward, normal weight upward, overweight obesity, class I obese upward, and class II/III upward). The normal weight downward and class II/III obese upward group had high mortality risk, while the overweight stable group had the lowest mortality. In our study, the weight trajectories of the LNWG and HNWG showed a decreased pattern during the study period and those of the OWG and OG were relatively stable. The OG had the highest survival rate, while the LNWG showed a higher risk of mortality. Although Zheng et al.11) analyzed a younger population (51–61 years), the differences were more likely due to racial differences. Since racial/ethnic differences in obesity status, body composition, and weight management behaviors have been reported, weight change and its association with life span may vary across racial/ethnic groups.4)
However, our results are similar to those of one Japanese study by Murayama et al. 13). They identified four distinct BMI trajectories in a 19-year follow-up of older Japanese adults and reported that adults who were overweight but stable had the highest survival rate. Thus, older East Asians may differ from older Americans in terms of weight distribution and patterns of weight change over time.
Compared with short-term (within 5 years) weight changes reported previously,6,7) weight changes in the four trajectory groups were small. However, body weight can fluctuate substantially over the adult lifetime; thus, weight changes measured at multiple points over an extended time (approximately 10 years) may provide additional information.13) Moreover, while previous studies categorized weight change groups using arbitrary criteria such as 5% gain or loss from baseline body weight,1) these approaches did not provide precisive individual classifications into the various bodyweight groups.13) Our trajectory modeling method can more precisely define weight change groups of real older populations, even if the changes are small.
People with low BMI are more likely to have less muscle and bone mass and increased body fat. Reduced muscle and bone mass increase the likelihood of osteoporosis and fractures and decrease body function, which in severe cases, leads to frailty and disability.19,20) Low muscle mass in the low BMI population causes deterioration of lung function and makes it difficult to withstand catabolic stress in respiratory crisis situations.21) In some studies, underweight people were more susceptible to respiratory disease and showed higher mortality rates.22) In contrast, high BMI suggests that muscle and body fat, which serve as energy and nutrient reserves, are likely to be sufficient.23) Underweight people could be undernourished, which reduces immune cell function, increasing these individuals’ susceptibility to infection.24) Underweight people are reportedly susceptible to infectious diseases such as tuberculosis.25) Studies have also shown higher probabilities of complications and mortality among individuals with chronic diseases, including CVD, and among those with lower BMI.26,27) Chronic disease can result in a catabolic state that, in turn, leads to wasting syndrome and metabolic stress situations with muscle, bone, and body fat loss.27) Accordingly, people who lack sufficient energy and nutrient reserves are intolerable. Moreover, insufficient nutrition prolongs hospitalization and increases mortality in hospitalized patients.28) Thus, high BMI may have a protective effect against various deteriorating conditions, which may improve survival.
Several limitations should be considered when interpreting our outcomes. In general, people overreport their height, and they (especially obese people) tend to underreport their weight, resulting in under-estimated BMI. The present study used subject-reported height and weight to calculate BMI, which could lead to biased results in BMI trajectory patterns. Second, there was the possibility of selection bias. The participants of the KLoSA study were residents enrolled nationwide to form a nationally representative database. Individuals in long-term care facilities were not included in this study. Moreover, 16.5% of participants were excluded from the analysis due to drop-out during the study period. Comparisons of the characteristics of the included and excluded participants are shown in Supplementary Table S4. In general, the excluded participants were older and had more morbidity than the participants included in the analysis. This difference means that more vulnerable participants were more likely to drop out during the study period. The sample admitted to long-term care facilities owing to chronic diseases during follow-up may have been excluded from the main panel data. The participants often have more functional limitations and comorbidity than those who live at home. Therefore, this analysis of the effect of BMI on mortality could have a limitation among people with high levels of frailty. Third, intentional and unintentional weight changes were not distinguished. As unintentional weight loss has a higher mortality risk than intentional weight loss,29,30) we adjusted for various underlying diseases and functional limitations that could lead to unintentional weight changes. Fourth, in determining the degree of obesity, BMI is not an optimal indicator. Since BMI is calculated based on total weight, it is not possible to directly measure the weight of body fat and muscle composition. Moreover, this calculation does not reflect the distribution of body weight. It is more advantageous to measure waist circumference when a person had central adiposity with high levels of fat in the abdomen;31) however, the present study did not adjust for waist circumference. Finally, only all-cause mortality was assessed. The associations with cause-specific mortality, such as death from cardiovascular or other causes, should also be investigated in future studies.
Nevertheless, this study has some important strengths. Most previous studies adopted methods of classifying BMI change into predetermined intervals arbitrarily, as defined by researchers. In contrast, this study used a trajectory model to express BMI change more objectively as a result, we identified four homogenous trajectory groups. Moreover, the relationship between BMI subgroup and mortality could be more accurately demonstrated through continuous and repeated BMI measurement over 10 years of follow-up. This study of data of the older population extracted from the KLOSA database has the advantage of a relatively large sample size and a prospective design. Physical assessment was performed using validated measures, and variables related to lifestyle and health were considered. Since this study included healthy community-dwelling residents in Korea, the findings can be generalized to the Korean population. Moreover, we performed the analyses after adjusting for multiple sociodemographic and behavioral variables (age, sex, marital status, educational level, co-morbidity, smoking, drinking, and regular exercise).
In conclusion, the results of our study showed dynamic associations between BMI and mortality among older adults in Korea. We identified a slight downward trajectory of BMI in the LNWG and HNWG groups and a stable trajectory in the OWG and OG groups. These findings are contrary to those in western populations, in which weight gain in the obese group and weight loss in the normal weight group were observed, but the findings are similar to those in Japan, where weight loss was observed in all subgroups except for the OWG. The OG group had the highest survival rate, while the LNWG group had a higher risk of mortality. This research suggests that baseline obesity status and degree of weight loss during the follow-up period contributed to mortality in later life. Further studies are needed to determine the mechanism of these results in more detail.
Notes
CONFLICT OF INTEREST
The researchers claim no conflicts of interest.
Funding
This study was supported by Wonkwang University in 2020.
AUTHOR CONTRIBUTIONS
Conceptualization, JL; Data curation, JWK, JL; Investigation, JWK, JL; Methodology, TP, DRL; Project administration, JL; Supervision, JL; Writing-original draft, JWK; Writing-review & editing, TP, DRL, JL.
Supplementary Materials
Comparison of BIC between the selected fitted-model
Diagnostics of model performance
Cox proportional hazard ratio of all-cause mortality according to BMI trajectories in older men
Cox proportional hazard ratio of all-cause mortality according to BMI trajectories in older women
Comparisons of characteristics between the included and excluded subjects in the analysis and between the surviving and deceased subjects during the study period
Sensitivity analysis
Body mass index (BMI) trajectories of the participants during study period: (A) male and (B) female.
Kaplan-Meier survival curves in participants: (A) male and (B) female.