Visualizing Domains of Comprehensive Geriatric Assessments to Grasp Frailty Spectrum in Older Adults with a Radar Chart
Article information

Frailty, defined as vulnerability to possible stressors in older adults, reflecting decreased physiological reserve (Fig. 1), is widely accepted as a measure of human biological aging, a predictor of predictor of adverse outcomes, and outcome measures of interventions in geriatric research.1,2) There remains controversy regarding frailty concepts and clinical definitions—i.e., physical frailty and frailty by deficit accumulation—although there is a growing consensus that both concepts are well correlated and generally point toward a systemic, biological aging phenotype in older adults.1,3-5) Researchers have also attempted to separate varying features of the frailty spectrum, including social frailty, oral frailty, and cognitive frailty, to better understand heterogeneous aging phenotypes among persons.6-8) Among these approaches toward frailty, the frailty index, based on deficits in parameters from comprehensive geriatric assessments (CGAs), is accepted as one of the most well-validated measures to predict mortality in older adults.9,10)
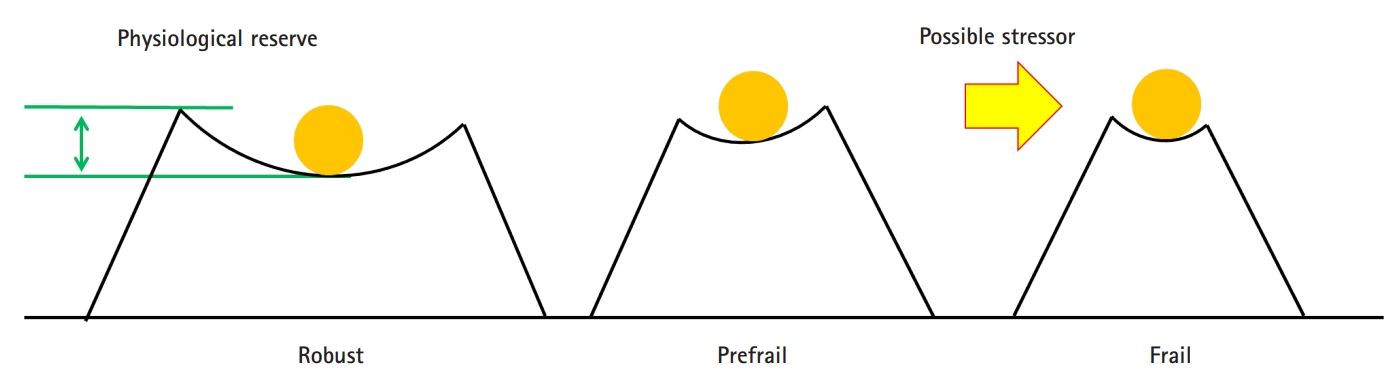
Frailty status as a spectrum of physiological reserve and vulnerability to possible stressors.
However, there are caveats in utilizing CGAs and the frailty index in clinical practice for older adults. Because CGA results are usually presented using scales from multiple domains and narrative descriptions that are acquired through extensive examinations and interviews, imagining patients’ clinical frailty status is an unfamiliar task for most non-geriatric healthcare providers. In contrast, the frailty index is presented as a single score from 0 to 1, and it provides a seemingly more tangible, quantitative feeling; however, domain-specific functional status is not apparent with the frailty index, as the scale is one-dimensional because of the aggregation of all parameters in the CGA domains.
To visualize multiple attributes from CGA data to simultaneously provide quantifiable features for better interpretation of CGA data and the concept of frailty, the author suggest the use of a domain-specific radar chart with an inner area indicating the physiologic reserve and an outer area indicating the frailty index (Fig. 2). Because the varying ranges of domain-specific instruments in CGA might be unfamiliar to non-geriatric specialists, this radar chart approach may facilitate communication between healthcare providers to foster shared inter-professional decision-making. Also, this type of plot can make the interpretation of CGA parameters, in order to grasp which domains are impaired, easier, allowing physicians to tackle those with deficits. For example, in Fig. 2, the radar chart of an imaginary person shows that cognitive performance is relatively impaired; thus, physicians can more vigilantly prevent delirium at hospitalization.11) Furthermore, with accumulating research evidence showing that the frailty spectrum is amenable to structuralized interventions,12) domain-specific longitudinal improvements of intervention programs might be more readily described with this radar chart.
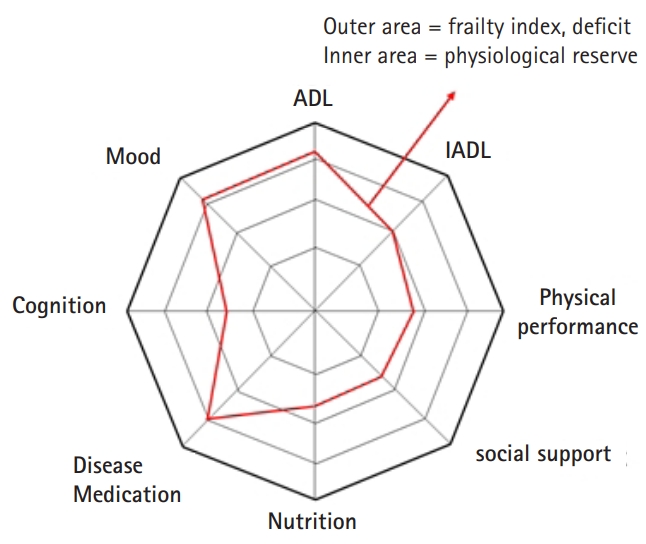
Radar chart of a comprehensive geriatric assessment for an imaginary person. ADL, activity of daily living; IADL, instrumental activity of daily living.
Although qualitative or quantitative evidence on the advantage of visualizing CGA and frailty status is not yet available, I hope to see future studies utilizing this approach both in research and in clinical care for older adults.
Notes
CONFLICT OF INTEREST
The author claims no conflicts of interest.