Handgrip Strength in the Korean Population: Normative Data and Cutoff Values
Article information
Abstract
Background
We aimed to report the age- and sex-specific normative data of Korean handgrip strength (HGS) and to establish the cutoffs values of low HGS in Korean populations.
Methods
We analyzed the HGS data of 23,716 Koreans (10,793 men and 12,923 women) from the Korea National Health and Nutrition Examination Survey from 2014 to 2017. The means with standard deviations (SDs) of HGS were calculated for each 5-year interval starting from 10 years of age. To determine the relationship between HGS and body mass index (BMI), correlation analysis was also performed. The sex-specific cutoff values for low HGS were presented by deriving the –2 SD values of healthy young adults.
Results
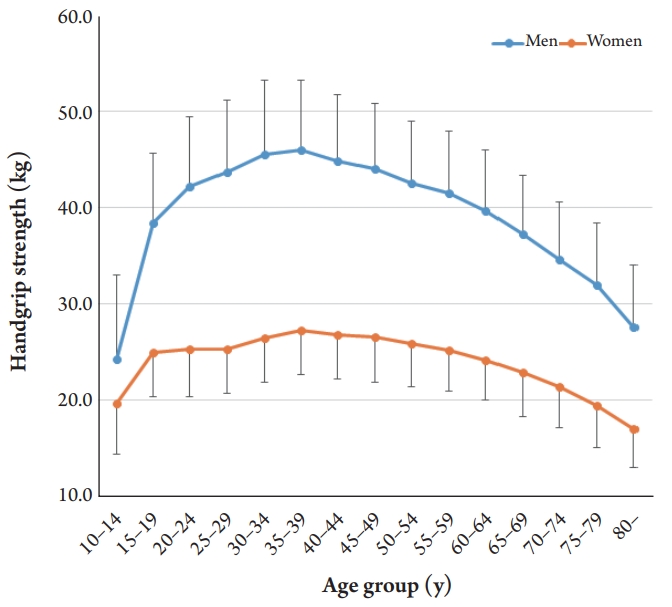
The mean HGS was 39.5±9.3 kg in men and 24.4±5.3 kg in women. The mean HGS increased from 10 to 39 years and peaked at 35–39 years in both men (46.0±7.2 kg) and women (27.2±4.6 kg). Men showed a higher correlation between HGS and BMI (r=0.378) than did women (r=0.134). The cutoff values for low HGS were 29.6 kg for men and 16.8 kg for women for –2 SD below the reference for healthy young adults.
Conclusion
In Koreans, the mean HGS peaked at 35–39 years in both men and women, and the aging curve of HGS was steeper in men than in women. The cutoff values for low HGS were 29.6 kg and 16.8 kg for men and women, respectively.
INTRODUCTION
Handgrip strength (HGS) is a simple, fast, and inexpensive measurement of maximum voluntary muscle strength. It is an important tool used for the diagnosis sarcopenia and is widely used as a single indicator of overall muscle strength.1-4) HGS predicts not only overall muscle mass and mobility5) but also the incidence of chronic diseases or cardiovascular disease, nutritional state, quality of life, independence of daily life, length of hospital stay, and mortality.6-8) The European Working Group on Sarcopenia in Older People (EWGSOP) and the Asian Working Group for Sarcopenia (AWGS) recommend HGS as one of the axes for sarcopenia diagnosis.1,2)
As HGS varies by age, sex, and race, the cutoff values for low HGS remain controversial.9) Furthermore, HGS can also vary depending on the calculation method for the cutoff and the protocol for HGS measurement.10) Although sarcopenia working groups such as the EWGSOP and AWGS have suggested cutoff values for low HGS, research in the Korean population is limited. Yoo et al.11) suggested the use of HGS cutoff values based on the lower 20th percentile among 4,553 Koreans. One cross-sectional study of 7,969 Koreans proposed cutoff values derived from two standard deviations below the HGS values for healthy young adults, on the basis of data.12) Different cutoff values among Asians have been studied in countries of the same race.9) Even within the same Asia, several countries have showed different cutoffs of HGS, so it is not reasonable to unify Asians as one HGS cutoff. It is very meaningful to have normative HGS data in each country. Therefore, further studies with a larger Korean population are needed to provide normative data on HGS in Koreans according to sex and age.
This study reports age- and sex-specific normative data on HGS and establishes cutoff values for low HGS in the Korean population using data from the Korea National Health and Nutrition Examination Survey (KNHANES) from 2014 to 2017.
MATERIALS AND METHODS
Data Source and Study Population
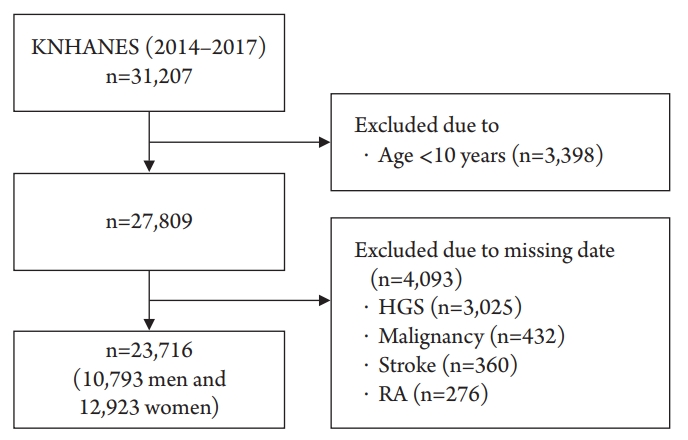
The data for this study were obtained from the KNHANES conducted from 2014 to 2017 by the Korea Centers for Disease Control and Prevention. The KNHANES is a population-based cross-sectional survey designed to assess health-related behaviors, health conditions, and the nutritional state of Koreans (http://knhanes.cdc.go.kr/). The study used a stratified, multistage, probability sampling method to select the study participants. From this pool of data (n=31,207), we included participants aged ≥10 years (n=27,809) who had completed the HGS test (n=24,784). Persons who had a medical history of cerebrovascular accidents (n=360), rheumatic arthritis (n=276), and any malignancy (n=432) were excluded. We finally included 23,716 participants (10,793 men and 12,923 women) in this study (Fig. 1). All of them provided written informed consent, and the Korea Centers for Disease Control and Prevention Institutional Review Board (ethical review committee for health survey data) approved the study protocol (No. 2015-01-02-6C).
Health Survey
A health questionnaire was used to obtain information on age, sex, socioeconomic status (house income), and educational status. Body weight and height were measured in light clothing without shoes. We calculated body mass index (BMI, kg/m2) as weight divided by the square of height. Information on comorbidities including cerebrovascular accidents, rheumatoid arthritis, and any type of malignancy was examined through health interview surveys.
HGS Measurement
HGS was measured using a digital hand dynamometer (T.K.K 5401; Takei, Tokyo, Japan) that measured between 5.0 and 100.0 kg of force in 0.1 kg increments and had an adjustable grip span. During the assessment, the participants were asked to stand upright with their feet hip-width apart and to look forward with the elbow fully extended. The dynamometer was held using the testing hand in a neutral, comfortable position (not flexed or extended) with 90º of flexion at the index finger. The participants performed three trials for each hand alternately, always starting with the dominant hand. The participants were instructed to squeeze the grip continuously with full force for at least 3 seconds and were asked not to swing the grip dynamometer during the test and not to hold their breath.11) A resting interval of at least 30 seconds was allowed between each measurement.13) HGS was defined as the maximally measured grip strength among the six measurements.
HGS Cutoff Values
First, using normative data from healthy young adults (20–39 years) as the reference, we calculated the cutoff value as 2 standard deviations (SD) below the mean reference value, as recommended by the EWGSOP.14) Second, a healthy population of older adults was selected as the reference group, and their sex-specific quintiles (lowest 20%) were also used as cutoff values.11)
Statistical Analysis
The participants' characteristics were presented as means (SD) or percentages. The mean and SD of HGS and 95% confidence intervals (CIs) were calculated for each 5-year interval starting from 10 years of age. We compared the participants' characteristics according to sex using t-test and χ2 test for continuous and categorical variables, respectively. Pearson’s correlation coefficients were used to analyze the correlations between HGS and BMI. We used PASW Statistics version 18.0 (SPSS Inc., Chicago, IL, USA) for all analyses with statistical significance set at p<0.05.
RESULTS
The mean age and BMI of the 23,716 participants were 46.3±19.7 years and 23.5±3.7 kg/m2, respectively. The men were younger than the women (45.7±20.0 vs. 46.9±13.9 years; p<0.001). Education level, household income, and their differences according to sex are shown in Table 1.
The mean HGS was 39.5±9.3 kg in men and 24.4±5.3 kg in women. The mean HGS increased from 10 to 39 years, peaking at 35–39 years in both men (46.0±7.2 kg) and women (27.2±4.6 kg) (Table 2). After this age, the HGS decreased. The aging curve was steeper in men than in women (Fig. 2). A 10% loss of mean HGS from the peak value was observed at 55–59 years in men and 60–64 years in women.
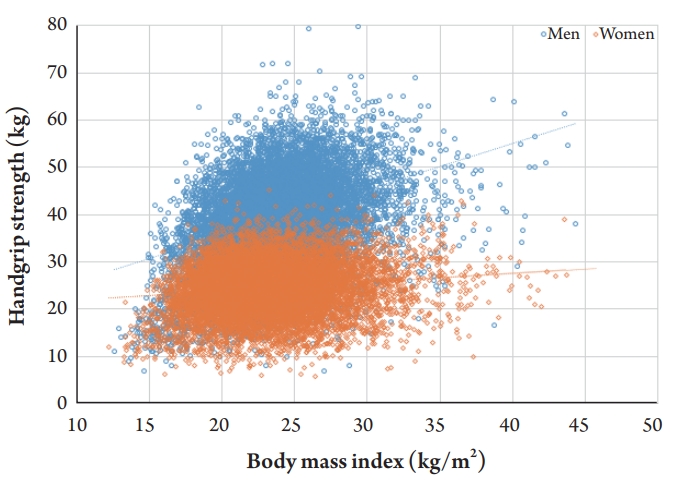
A positive correlation between BMI and HGS was observed in both men and women. However, men showed a higher correlation (β=0.976 and r=0.378) than did women (β=0.190 and r=0.134) (Fig. 3). The cutoff values for low HGS (–2 SD below the reference of healthy young adults) were 29.6 kg for men and 16.8 kg for women. However, the cutoff values according to the lowest quintile of elderly populations were 28.6 kg for men and 16.4 kg for women (Table 3).
DISCUSSION
The most important finding of this study was that the mean HGS peaked at 35–39 years of age in both men and women. The aging curve of HGS was steeper in men than in women. Men showed a higher correlation between HGS and BMI than that in women. In this Korean population, the cutoff values for low HGS were 29.6 and 16.8 kg for men and women, respectively. To our knowledge, this is the largest (n=23,716) cross-sectional study to report normative HGS data.
Several studies have suggested cutoff values for low HGS. The revised EWGSOP2 guidelines defined low HGS as <27 kg for men and <16 kg for women on the basis of cutoff values –2.5 SD below the mean reference for young adults.2) The Foundation for the National Institutes of Health (FNIH) Biomarkers Consortium Sarcopenia Project recommended cutoff points for low HGS of <26 kg for men and <16 kg for women.15) In Asian populations, the AWGS first proposed a low HGS cutoff value of <26 kg for men and <18 kg for women or the lower 20th percentile of the HGS of the study population without outcome-based data.16) An update from the AWGS in 2016 suggested that the previous consensus cutoff points might require further modifications,1) and Auyeung et al.17) recently defined low HGS as <28.0 kg for men and <17.7 kg for women on the basis of a pooled dataset from various Asian countries (Table 3).17)
Although, even in Asia, different cutoff values have been reported in studies of Koreans. Yoo et al.11) analyzed HGS data of 4,553 Koreans in the 2015 KNHANES and suggested cutoff values of 28.6 and 16.4 kg for men and women, respectively, on the basis of the lower 20th percentile of the HGS of the study population. Another study analyzed HGS data of 7,969 Koreans from the 2014–2015 KNHANES and proposed cutoff values of 28.9 kg for men and 16.8 kg for women, derived from 2 SD below the values for healthy young adults.12) In the current study, the cutoff values for low HGS were 29.6 and 16.8 kg for men and women, respectively.
Attention should be paid to the interpretation of the HGS test results as HGS values may vary depending on the measuring instrument and protocol. Amaral et al.18) compared the accuracy and reliability of three types of hand-held dynamometers (Jamar dynamometer, Takei dynamometer, and EMG System Manual Transducer with modified handle), reporting that the shape of the dynamometer handle influenced the measurement of HGS and that the HGS may show different results depending on the measuring instruments. Balogun et al.10) studied the effects of testing posture and elbow position on HGS measurements, reporting significant differences between HGS measured in a sitting position with the elbow in 90° flexion and that measured in a standing position with the elbow fully extended. One study assessed the effect of handedness on HGS, reporting that the definition of handedness varied considerably and that a non-dominant hand could have a higher HGS than a dominant hand.19) Therefore, HGS measurements using only the dominant hand11) are not recommended. Furthermore, previous studies on HGS did not standardize the number of grips per test and the use of the average or maximum values after repeated measurements. Thus, a standardized test protocol for HGS measurement is required as HGS varies according to the measuring tool, testing posture, frequency of measurements, use of average or maximum values of repeated measurements, and use of the dominant or non-dominant hand.
Whereas HGS showed similar patterns with age, we observed a difference according to sex. The HGS of men increased markedly until their 30s and then decreased steeply until 80 years of age. However, the changes in HGS with age occurred differently in women, increasing slowly until their 30s, remaining constant until their 40s to 50s, and then decreasing after 65 years of age (Fig. 2). Thus, a 10% loss of mean HGS from the peak value was observed at 55–59 years in men and at 60–64 years in women. Sex differences have also been reported in the aging of skeletal muscle mass.20-22) The mechanisms leading to absolute sex differences in the reduction of muscle mass and strength with increasing age are unknown, although hormonal factors are most likely involved.23) Canon and Crimmins24) reported that a few inflammation markers associated with sarcopenia were also correlated with sex hormones. Therefore, future research should examine the influence of menopause and andropause on sarcopenia.
The results of this study demonstrated the strong association between HGS and BMI, especially in men (Fig. 3). Several previous studies have supported the association between HGS and BMI. Pasdar et al.25) reported significantly increased HGS with increasing BMI in both men and women, with a more significant relationship in men than in women. Keevil et al.26) also reported this sex difference, suggesting that it might originate from differences in adipokine levels between men and women.27) One study with cross-sectional data from eight cohort studies (n=16,444) also showed that increased HGS was associated with a higher BMI only in men,28) which the authors attributed to a lower proportion of lean mass in women than in men because of genetic, hormonal, and environmental differences.
Therefore, comparisons of HGS should be adjusted or stratified by BMI, especially in men. An update from the AWGS in 2016 recommended stratification of cutoff values for low HGS by BMI, proposing the corresponding cutoffs for low HGS with BMI <22.1, 22.1–24.3, 24.4–26.3, and >26.3 kg/m2 of 25.0, 26.5, 26.4, and 27.2 kg, respectively, for men and with BMI <22.3, 22.3–24.2, 24.3–26.8, and >26.8 kg/m2 of 14.6, 16.1, 16.5, and 16.4, respectively, for women.1) Wu et al.29) also proposed corresponding cutoffs of low HGS for different BMI groups using data from community-dwelling Taiwanese. The FNIH sarcopenia project also showed alternative HGS values adjusted for BMI.15)
Our study has several limitations. First, other diagnostic criteria for sarcopenia, such as skeletal muscle mass or gait speed, were not included in the analysis. Therefore, is hard to determine how well our cutoff values relate to low muscle mass or gait speed. Second, as this study was based on a cross-sectional design, we only reported the mean HGS values for each age group. Additional prospective cohort studies are needed to analyze individual changes in HGS over time. Third, although our study identified the close relationship between BMI and HGS, we did not suggest different HGS cutoffs for stratified BMIs. Further research is needed to propose how to adjust HGS for BMI for a more accurate criterion for the diagnosis of sarcopenia. Finally, although HGS measurement is relatively simple, the measurement methods are not uniform worldwide, making comparisons between studies difficult.
In conclusion, we proposed the cutoffs values for low HGS as 29.6 kg for men and 16.8 kg for women on the basis of national data from 23,716 Koreans. Our data may be useful for future research on sarcopenia in the Korean or other Asian populations.
Notes
The researchers claim no conflicts of interest.
Acknowledgements
This work was supported by a National Research Foundation of Korea grant funded by the Ministry of Science and ICT (MSIT) (No. 2019R1C1C100632).


