Diabetic Peripheral Neuropathy as a Risk Factor for Sarcopenia
Article information

Abstract
Background
Diabetic peripheral neuropathy (DPN) is prevalent in patients with type 2 diabetes, and its prevalence increases with age. A previous study demonstrated the association between DPN and muscle dysfunction; however, there are limited data on the association between DPN and sarcopenia.
Methods
We enrolled patients with type 2 diabetes and measured hand grip strength (HGS), lean body mass using a bio-impedance analysis, and gait speed using a 4-m walking test. Sarcopenia was diagnosed according to the criteria from the Asian Working Group for Sarcopenia. We also performed various examinations of neuropathy, including both small- and large-fiber neuropathy.
Results
Among 170 participants (mean age, 61.5±6.6 years), 24 (14.1%) were diagnosed with sarcopenia. The Michigan Neuropathy Screening Instrument Questionnaire (MNSI-Q) scores were higher in patients with sarcopenia than in those without sarcopenia (2.7±1.3 vs. 2.4±1.3; p=0.008). However, other neuropathy examination results were not significantly associated with sarcopenia. The MNSI-Q score was negatively associated with HGS, with an odds ratio (OR) of 1.367 (95% confidence interval [CI], 1.122–1.667) in predicting the presence of sarcopenia. After adjusting for sex, body mass index, and diabetes duration, the MNSI-Q score was associated with the presence of sarcopenia (adjusted OR=1.310; 95% CI, 1.041–1.647).
Conclusion
In this population with type 2 diabetes, patients with sarcopenia had higher neuropathy questionnaire scores than those without sarcopenia. Therefore, active screening for sarcopenia should be performed in subjects with DPN.
INTRODUCTION
Sarcopenia is prevalent in patients with type 2 diabetes,1,2) and the prevalence of both conditions increases with age.3) Various risk factors for sarcopenia in patients with type 2 diabetes have been reported. For example, poor glycemic control was related to decreased muscle quality and performance in a Korean population with type 2 diabetes who were aged 65 years or older.4) In addition, longer diabetes duration and dyslipidemia were associated with reduced skeletal muscle mass in a Japanese observational study.5) Recently, higher levels of advanced glycated end-products (AGEs) were reported in patients with sarcopenia, and the accumulation of AGEs was related to decreased muscle mass and strength.6) Because AGEs play a pathological role in diabetic vascular complications, there might be a close association between sarcopenia and chronic diabetes complications.
Diabetic peripheral neuropathy (DPN) is a microvascular complication, and hyperglycemia and other metabolic conditions are highly related to DPN.7) Compared with other diabetic microvascular complications, DPN may be directly associated with muscle dysfunction because muscles are directly innervated by peripheral nerves and their functions are controlled by nerve activity.8) A previous observational study of 39 patients aged 70–79 years showed decreased muscle performance in subjects with DPN compared with that in non-diabetic people.9) Another observational study confirmed this finding in 10 subjects with diabetes with a mean age of 57.2 years.10) However, there are limited data on the association between sarcopenia and DPN in large populations; therefore, larger-scale studies are needed to evaluate the association between DPN and sarcopenia.
This study aimed to evaluate muscle mass, strength, and physical performance in subjects with type 2 diabetes and assess whether DPN was a significant risk factor for sarcopenia.
MATERIALS AND METHODS
Participants
We analyzed data from patients with type 2 diabetes who were enrolled in an ongoing prospective observational study. The procedure and inclusion and exclusion criteria of the study have been described previously.11) Briefly, the study participants were enrolled from an outpatient clinic of a tertiary academic hospital. We used a new screening tool for DPN in which the examination required the participants to stand by themselves for more than 2 minutes. We excluded participants with neuropathy owing to other causes such as thyroid disease, history of chemotherapy, and heavy alcohol consumption. The current analysis included data from a subgroup of participants aged 50 years and older. The study was approved by the Institutional Review Board of Seoul National University Bundang Hospital (No. B-1911/577-104). Written informed consents were obtained.
Medical History and Anthropometric and Biochemical Analyses
Medical history such as diabetes duration and medication was collected using a structured questionnaire. Anthropometric analysis, including body weight and height measurements and bio-impedance analysis (InBody 770; InBody, Seoul, Korea), was performed with the participants wearing light clothes. Body mass index (BMI) was calculated as body weight/height (kg/m2). Systolic and diastolic blood pressures were measured using an electronic blood pressure meter after 10-minute rest. Blood was drawn after an overnight fast. Renal function and glucose, glycated hemoglobin (HbA1c), total cholesterol, triglyceride, high-density lipoprotein (HDL) and low-density lipoprotein (LDL)-cholesterol levels were assessed using the protocol of the central laboratory.
Neuropathy Evaluation
Trained research nurses performed neuropathy evaluations, the results of which were confirmed by endocrinology specialists. Annual screening for neuropathy in subjects with type 2 diabetes start at diagnosis.12) Neuropathy was evaluated using the Michigan Neuropathy Screening Instrument Questionnaire (MNSI-Q), MNSI physical examination (MNSI-PE), a 10-g monofilament test, and SUDOSCAN (Impeto Medical, Paris, France). SUDOSCAN noninvasively measures electrochemical skin conductance;13) we included this measurement to complement the other methods of evaluating neuropathy.
Sarcopenia Assessment
Trained research nurses measured hand grip strength (HGS) using a digital grip strength dynamometer (GRIP-D; Takei Scientific Instruments, Tokyo, Japan) by following a standard protocol14) after requesting that the subjects not perform vigorous exercise before the measurement. The nurses measured HGS twice for each hand, and we used the mean value of the dominant hand in our analysis. The parameter of muscle mass index was the appendicular skeletal muscle mass (ASM) divided by the height squared (m2) (ASM/ht2).15) Low muscle strength and muscle mass were defined as values below the cutoffs of 26 kg and 7.0 kg/m2, respectively, for men and 18 kg and 5.7 kg/m2, respectively, for women.16) We assessed walking speed using a 4-m walking test, with the mean values of two trials used in our analysis. Sarcopenia was diagnosed according to the Asian Working Group for Sarcopenia (AWGS) criteria.16)
Statistical Analysis
We presented the data as mean±standard deviation or as numbers and percentage. The differences between patients without and with sarcopenia were tested using parametric or non-parametric t-test and chi-square test. Simple correlations between parameters were evaluated by Spearman correlation analysis. Logistic regression analysis was used to identify risk factors associated with sarcopenia. We chose covariates from among the variables that differed significantly between patients with and without sarcopenia considering their clinical importance and multicollinearity. All variables, except sex, were continuous variables in logistic regression analysis. Statistical analysis was conducted using IBM SPSS Statistics version 22 for Windows (IBM SPSS, Armonk, NY, USA). Two-sided p-values <0.05 were considered statistically significant.
RESULTS
Among 170 participants, 24 (14.1%) had sarcopenia. The participant characteristics are shown in Table 1. More women than men had sarcopenia. Body weight and BMI were lower in patients with sarcopenia than in those without sarcopenia. Furthermore, diabetes duration was longer in subjects with sarcopenia than in those without sarcopenia (14.6±8.3 vs. 10.1±7.3 years; p=0.009). The MNSI-Q scores were higher in patients with sarcopenia than in those without sarcopenia (2.7±1.3 vs. 2.4±1.3; p=0.008). However, the results of other neuropathy examinations, including MNSI-PE, 10-g monofilament test, and electrochemical skin conductance of feet obtained using SUDOSCAN, did not differ between the groups. More patients with sarcopenia were treated with insulin than patients without sarcopenia.
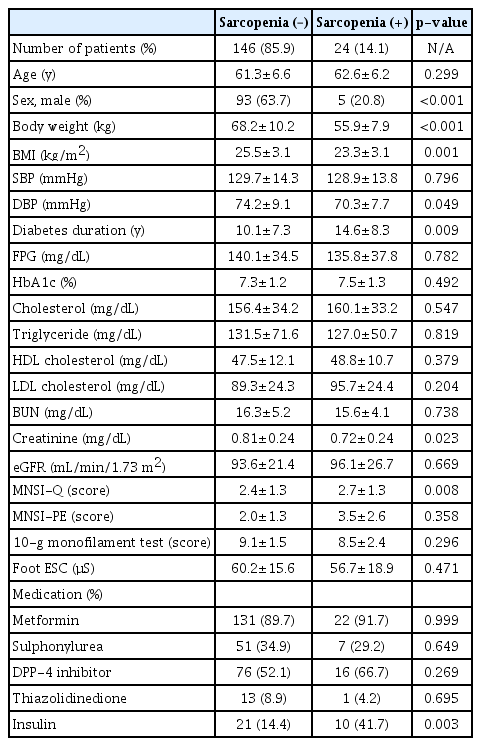
Clinical and biochemical characteristics according to the presence of sarcopenia
Table 2 shows the results of the evaluation of sarcopenia parameters. We observed large differences in ASM, ASM/ht2, and HGS between the groups; however, walking speed showed only a decreasing trend in the sarcopenia group. To determine the association between muscle measurements and DPN, we conducted a correlation analysis for each sex (Table 3). In men, HGS was significantly associated with the MNSI-Q score and the results of MNSI-PE, 10-g monofilament test, and electrochemical skin conductance of the feet. However, no parameters were significantly associated with ASM/ht2. In women, only the MNSI-Q score showed a negative association with HGS.
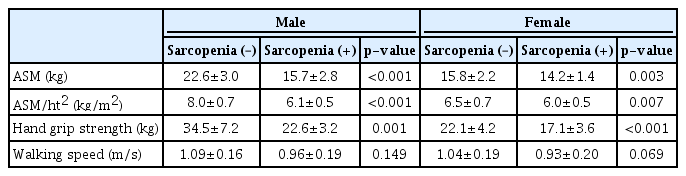
Anthropometric data according to the presence of sarcopenia for each sex

Correlation coefficients between muscle mass index or HGS and neuropathy examination
Table 4 shows the results of logistic regression analysis. Subjects with sarcopenia had substantially higher odds ratio (OR) for diabetes duration (OR=1.075; 95% confidence interval [CI], 1.018–1.134) and the MSNI-Q score (OR=1.367; 95% CI, 1.122–1.667). After adjusting for sex, BMI, and diabetes duration, the MSNI-Q score was significantly associated with the presence of sarcopenia (adjusted OR=1.310; 95% CI, 1.041–1.647).
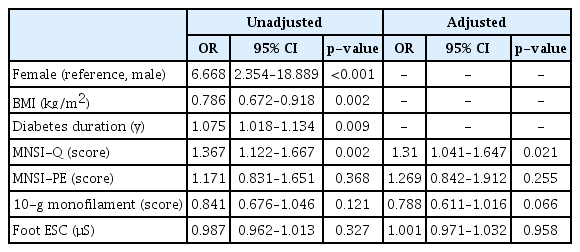
Logistic regression analysis of the risk factors for sarcopenia
DISCUSSION
We observed a sarcopenia prevalence of 14.1% among patients with type 2 diabetes from a single tertiary academic hospital. Patients with sarcopenia had lower BMI, longer diabetes duration, and higher rates of insulin therapy. Therefore, more severe diabetes might be related to sarcopenia. Patients with sarcopenia also had higher MNSI-Q scores than those without sarcopenia. After adjusting for sex, BMI, and diabetes duration, the MNSI-Q score was significantly associated with the presence of sarcopenia.
While we adopted the AWGS criteria for sarcopenia,16) other diagnostic criteria exist for sarcopenia.17) Therefore, care is required when comparing our findings with those of other studies. Moreover, various evaluation tools are used for diagnosing DPN. In our study, we used a structured questionnaire that is widely applied in epidemiology studies7,18) and also performed key physical examinations. In addition, we performed a new technique, SUDOSCAN, to evaluate sudomotor dysfunction19) by detecting abnormalities in small-fiber nerve function.20) In the present study, only the neuropathy (MNSI-Q) scores were associated with the presence of sarcopenia. In contrast, the physical examination and small-fiber nerve function abnormality findings did not discriminate the presence of sarcopenia. In DPN evaluation, any single test is not superior to others because there were various types and distributions of nerve and they can be injured by metabolic consequences.21) In this regard, questionnaires on various symptoms might be more appropriate than any single examination to distinguish the presence of sarcopenia. Therefore, the clinical implication of our finding is that a simple questionnaire for DPN screening might be useful in identifying patients at a high risk for sarcopenia. Further validation studies using the same definitions and diagnostic tests are needed to confirm our findings.
We previously reported the association between abdominal obesity and DPN in middle-aged patients with type 2 diabetes.11) In that study, we did not observe a significant association between neuropathy examination results and lean body mass. Moreover, in the present study, we did not observe a significant association between muscle mass index and neuropathy evaluation findings in older patients. In contrast, HGS was significantly associated with neuropathy evaluation results, although correlation coefficients were small (–0.318 in men and –0.361 in women). Both skeletal muscle index and HGS are likely to be preserved until middle age in the Korean general population.17,22) This trend suggests the presence of factors related to the preservation of muscle homeostasis in young and middle-aged adults. Between muscle mass and muscle strength, the latter might be more vulnerable to metabolic deterioration and aging. Researches showed that muscle strength can predict poor health outcomes, including cardiovascular diseases, cancer, and lung diseases.23) Our identification of DPN as a risk factor for sarcopenia, especially for the deterioration of HGS, suggests that physicians should employ prevention strategies in older individuals with DPN to prevent sarcopenia.
The association between DPN and muscle function has been assessed in other populations. Resnick et al.9) reported that compared with non-diabetic controls, older patients with DPN (mean age, 74.5 years) showed decreased walking speed. Our study results was in accordance with this association between DPN and muscle function in a relatively younger population. In another small observational study by Scarton et al.,10) compared with non-diabetic controls, patients with DPN had incrased ankle rigidity. However, this study did not include data on the general function of the lower extremities such as walking speed. In summary, the results of the current study demonstrated the association between DPN and decreased muscle function based on the results of simple physical examinations in a wider range of participant characteristics and larger population size.
Our study had several limitations. First, we did not perform dual-energy X-ray absorptiometry. Bio-impedance analysis requires further validation with gold standard methods to improve its accuracy.24) Second, we did not evaluate the association between sarcopenia and DPN in age subgroups. Because DPN prevalence increases with age,25) a more significant association between sarcopenia and DPN is possible in older subjects. Third, we did not include nerve conduction data to estimate large-fiber nerve function. Fourth, we enrolled subjects from a single tertiary academic hospital. Thus, the findings of our study cannot be generalized.
In summary, the results of this study demonstrated a significant association between higher DPN questionnaire score and the presence of sarcopenia. Therefore, clinical screening for sarcopenia is necessary for patients with DPN.
Notes
The researchers claim no conflicts of interest.