The Association Between the Number of Natural Remaining Teeth and Appendicular Skeletal Muscle Mass in Korean Older Adults
Article information

Abstract
Background
The aim of this study was to examine the correlation between the number of remaining natural teeth (NRT) and the appendicular skeletal muscle mass index (SMI) in older adults.
Methods
This study was based on data from the 2008–2010 Korea National Health and Nutritional Examination Surveys. The participants were 2,378 older participants (984 men and 1,394 women) aged over 65 years. Survey dentists conducted oral health examinations, and ASM was measured using dual-energy X-ray absorptiometry.
Results
The participants with NRT≥20 had more ASM and SMI than those with NRT<20 in both sexes. SMI was correlated with NRT in men (r=0.018, p<0.001) and in women (r=−0.007, p<0.001). The positive correlation between the NRT and SMI remained significant in men even after adjusting for age, marital status, income, smoking, drinking, physical activity, protein intake, energy intake, calcium intake, body mass index, fasting blood glucose level, medications, and prostheses (β=0.011, p=0.001). In women, the correlation disappeared after adjustment for smoking, alcohol, physical activity, protein intake, energy intake, calcium intake, marital status, income, fasting basal glucose, medication administration, and prostheses.
Conclusion
This study showed a correlation between NRT and SMI in those ≥65 years of age in Korea. The relationship persisted in men, but not in women, even after adjusting for confounders.
INTRODUCTION
Oral health, and more specifically, the functioning of the mouth is closely related to the overall health of the elderly. Digestion of foods begins with chewing and depends largely on the condition of the teeth. Compared to older individuals with their own set of teeth, older individuals with complete dentures consume fewer calories and eat lower-quality foods, possibly leading to various diseases.1,2) Consequently, those with more than 20 teeth are more physically active.3) Poor oral health, such as fewer teeth, has been associated with disability. Dental function is crucial to the older adults, and the most important reflection of function is the number of remaining teeth.4–6)
Decreasing skeletal muscle mass is an important physical change associated with aging that can be objectively measured. A decrease in skeletal muscle mass can lead to improper responses to external stressors and vulnerabilities, which can further be associated with falls and trauma, functional disorders, increased hospital admission rates, decreased quality of life, and increased mortality.7–10)
A previous study reported that unfavorable oral health, including a reduced number of teeth, is associated with disability,6,11) decreased grip strength,12) nutritional intake,2,4) and weight.13) However, there is no study investigating the correlation between the number of teeth and skeletal muscle mass in the older adults. Thus, we aimed to determine the correlation between the number of remaining natural teeth (NRT) and appendicular skeletal muscle mass (ASM) in elderly Korean individuals using data collected from the Korea National Health and Nutrition Examination Surveys (KNHANES).
MATERIALS AND METHODS
Study Design and Participants
We analyzed the data from the Fourth and Fifth KNHANES, which were conducted in 2008–2010 by the Korea Centers for Disease Control and Prevention (KCDC). The sampling protocol of the KNHANES involves a representative sample of civilians in Korea who are not institutionalized and is designed as a complex, stratified, multistage, probability-cluster survey. The survey was performed by the Korean Ministry of Health. The survey targeted non-institutionalized Korean individuals who were aged over 1 year at the time of the study. The survey utilized stratified multistage probability sampling units based on geographic area, sex, and age that were determined using the household registries of the 2005 National Census Registry, the latest 5-year national census of Korea. Two hundred primary sampling units were selected nationally using the 2005 census data. The final sample set of the KNHANES included 4,600 households. A detailed description of the sampling can be found in the KNHANES report (KCDC 2008–2010).14)
A total of 29,235 participants were included in the KNHANES. Among them, 4,772 people aged over 65 years had a periodontal examination. We excluded individuals who did not have dual-energy X-ray absorptiometry (DXA) data (n=1,128); those who had a history of stroke, coronary artery disease, thyroid, lung, liver, or renal disease or any cancers (n=671); those with any missing test data (including fasting blood glucose) (n=162); and nonprostheses respondents (n=56). The exclusion criteria were chosen to ensure selection of healthy participants and to minimize the confounding effects of muscle mass. The present study included 2,378 participants.
Clinical Oral Examination
An oral health examination was conducted by survey dentists, and the data from participants whose teeth were orally examined as reported in the KNHANES were used. In previous studies, the presence of 20 teeth or more was considered necessary for maintaining adequate masticatory function.15,16) Therefore, participants were divided into 2 groups based on the NRT for mastication: NRT≥20 and NRT<20. The third molar was not considered in the analysis. To account for dental prostheses, participants were divided into those with no prostheses and those with one or more prostheses.17)
Measurement of ASM
All participants underwent DXA (DISCOVERY-W fan-beam densitometer; Hologic Inc., Holliston, MA, USA) to assess the body composition. A standardized daily quality control of the instrument had been performed using a spine phantom provided by the manufacturer before the study commenced. ASM, which reflects the mass of skeletal rather than smooth muscles, was measured to identify the decrease in muscle mass in relation to aging. ASM was calculated as the sum of muscle mass in the arms and legs, assuming all nonfat and nonbone tissue as skeletal muscle18) and the skeletal muscle mass index (SMI) was calculated by dividing ASM by the height squared in meters.
Anthropometric and Laboratory Measurements
The measurements of body weight and height were rounded to the nearest tenth of a kilogram and centimeter, respectively. Body mass index (BMI) was calculated as weight/height2 (kg/m2). Samples for blood tests were collected during the health examination survey. These samples were collected from the antecubital veins and refrigerated immediately. The samples were then transported on dry ice to a designated central testing facility. The blood samples were analyzed within 24 hours.
Measurements of Health-Related Variables
Socio-demographic factors included age, sex, income, and marital status. Income was adjusted for the number of household members and categorized into 4 groups of <25%, 25%–49%, 50%–75%, and >75% of total equivalized income. Alcohol consumption status was categorized as either yes or no. Participants were questioned about their level of physical activity during a week, with moderate exercise defined as strenuous physical activity performed for at least 20 minutes at a time, at least 3 times a week. Dietary intake including total energy, calcium, and protein intake was estimated using a 24-hour dietary recall questionnaire administered by a trained dietitian.
Ethics Statement
This study was approved by the Institutional Review Board of Kyung Hee University Hospital, Seoul, Korea (approval number: KMCIRB 1419-11).
Statistical Analysis
All data are presented as mean±standard error (SE) for continuous variables or as proportions (SE) for categorical variables. Participant characteristics were compared according to sex using an independent-samples Student t-test for continuous measures and Rao-Scott chi-square test for categorical measures. A regression analysis was used to assess the association between the NRT and SMI after adjusting for age and BMI, smoking, alcohol, physical activity, protein intake, energy intake, calcium intake, marital status, income, fasting basal glucose, medication administration, and prostheses. Statistical analyses were performed using the survey procedure in SAS ver. 9.2 (SAS Institute Inc., Cary, NC, USA) to account for the complex sampling design and to provide nationally representative prevalence estimates. A p-value of <0.05 was considered to indicate significance.
RESULTS
Of the 2,378 participants, there were 984 men (41.4%) and 1,394 women (58.6%) with a mean age of 71.9 years. The mean NRT was 16.3, and 486 men (49.4%) and 766 women (54.9%) had NRT<20. In both men and women, the proportion of the group with NRT<20 increased with age, and 84.62% of the men and 81.48% of the women over 85 years of age had NRT<20. In women, there were differences in age, marital status, income, smoking, BMI, prostheses, nutrition, and muscle mass between those with NRT≥20 and those with NRT<20. In men, age, smoking, BMI, prostheses, nutritional status, and muscle mass differed between the 2 groups. Marital status and low family income were associated with NRT<20 only in women. The mean ASM was 20.17 and 21.21 kg in men with NRT<20 and NRT≥20, respectively (p<0.001) and 14.02 and 14.48 kg in women with NRT<20 and NRT≥20, respectively (p<0.001). The mean SMI was 7.47 and 7.74 kg/m2 in men with NRT<20 and NRT≥20, respectively (p<0.001) and 6.25 and 6.26 kg/m2 in women with NRT<20 and NRT≥20, respectively (p=0.782) (Table 1).

Demographic characteristics
Fig. 1 illustrates the difference in SMI between NRT<20 group and NRT≥20 group. The positive correlation between the NRT and SMI was significant in men even after adjusting for age and BMI, smoking, alcohol, physical activity, protein intake, energy intake, calcium intake, marital status, income, fasting basal glucose, medication administration, and prostheses. We also found functional NRT (NRT≥20) well discriminated the SMI. But in women, the correlation was inverse after adjustment for smoking, alcohol, physical activity, protein intake, energy intake, calcium intake, marital status, income, fasting basal glucose, medication administration, and prostheses (Table 2).
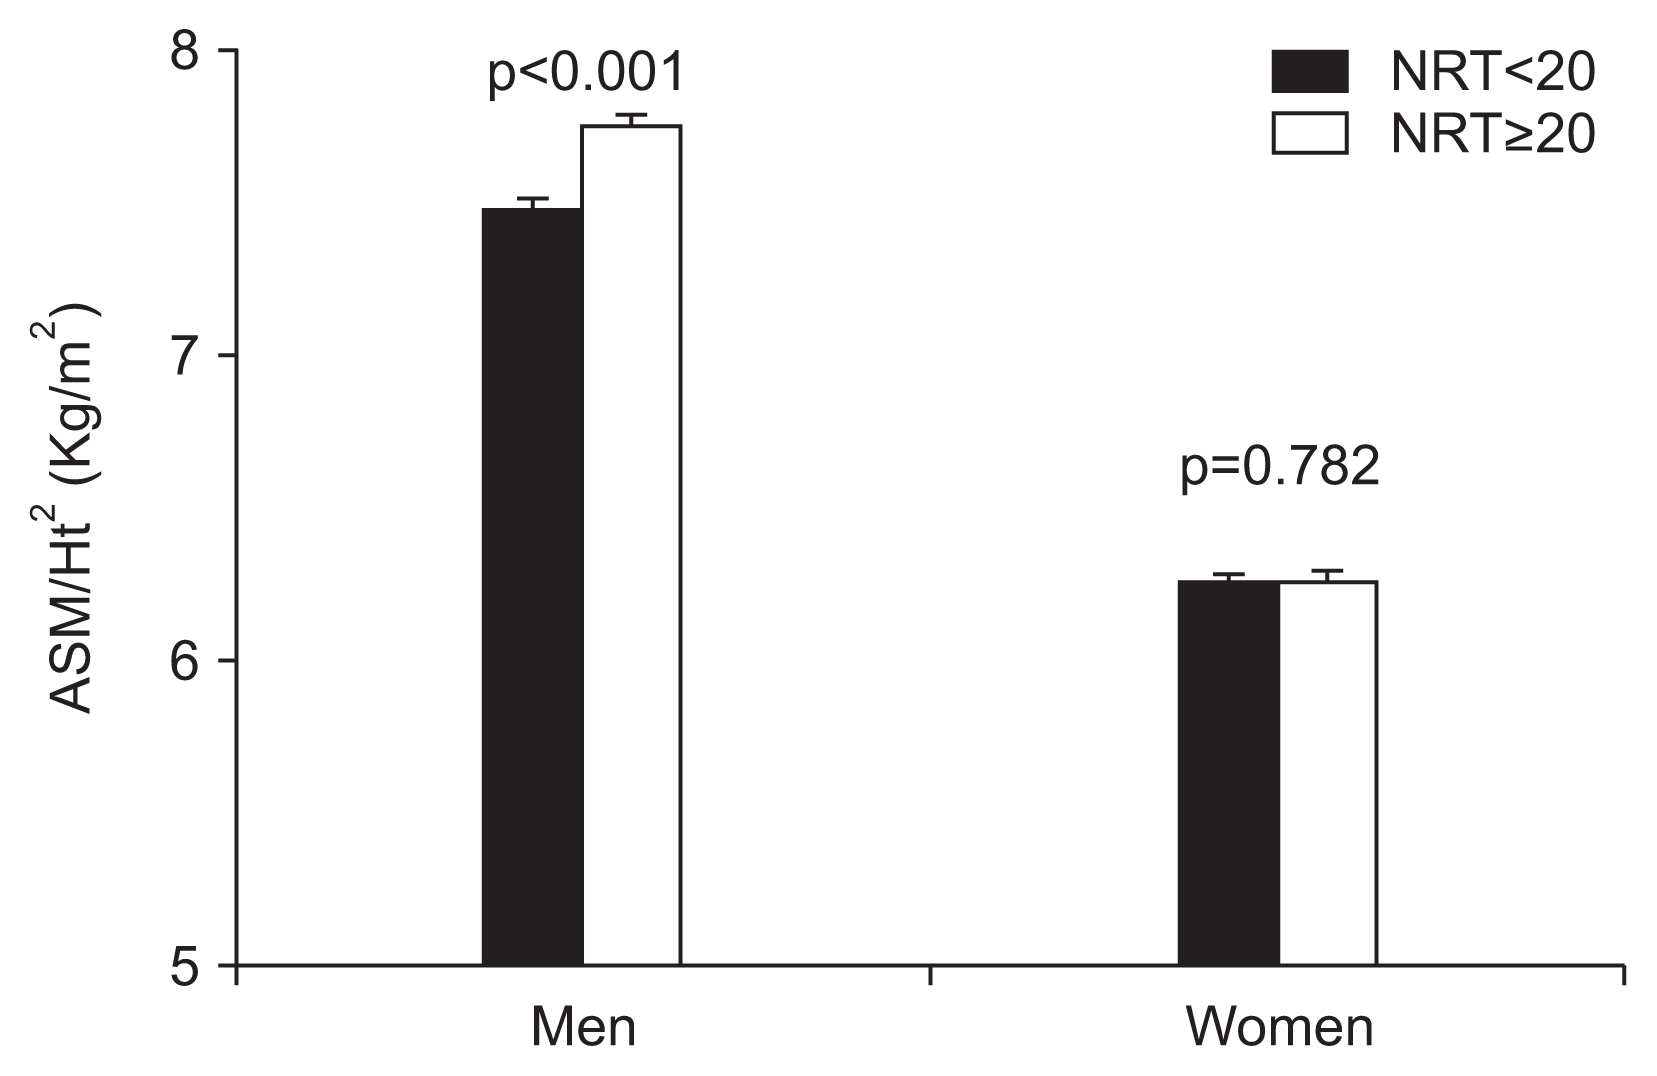
Comparison of SMI between NRT<20 and NRT≥20 groups. NRT, number of remaining natural teeth; ASM, appendicular skeletal muscle mass; Ht, height.
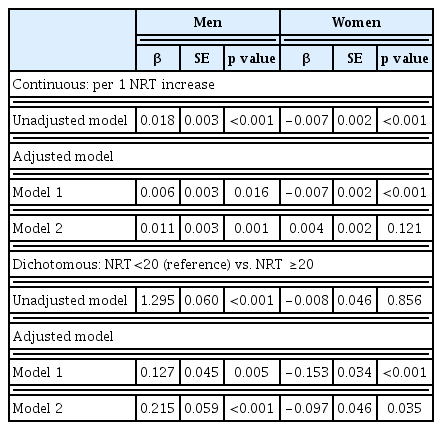
Multivariate regression for skeletal muscle mass index (SMI) per 1 NRT increase and according to dichotomized NRT (<20 or ≥20)
DISCUSSION
This is, to the authors’ knowledge, the first study to identify the correlation between the NRT and SMI, both of which are important for the overall health and quality of life in the elderly. In both men and women, a lower NRT was related to a lower SMI.
A reduction in the number of teeth can lead to nutritional deficiencies, resulting in muscle loss. Hildebrandt et al.19) report that older adults with reduced functional dentition are more likely to avoid food with certain characteristics, such as meat (tough to chew), raw carrots (hard), and dry foods. The resulting malnutrition and decrease in protein intake may affect the metabolic function of the body and can lead to the loss of muscle mass.20) However, interestingly, the relation between the number of teeth and SMI was still significant after controlling for protein intake in men. The relation between low SMI and low NRT in men may also be due to other reasons. For example, a decreased number of teeth may also be related to reduced mental capacity and/or reduced gastrointestinal function resulting in limited food choices and malnutrition.21) Furthermore, the relationship between the reduction in NRT and the decrease in skeletal muscle mass may be confounded by periodontitis.22)
However, in women, a relationship between the NRT and SMI was not found after controlling for smoking, alcohol, physical activity, protein intake, energy intake, calcium intake, marital status, income, fasting basal glucose, medication administration, and prostheses.
It is well known that in older adults, both the number of teeth and ASM are related to social and economic factors; those with a higher income and higher educational level as well as those who live with a spouse and live in a city have been known to possess a higher number of functional teeth.23,24) Furthermore, skeletal muscle mass in Korean women is much more affected by BMI, lifestyle, intake, marital status, and socioeconomic status than it is in men.25) Another possible explanation is that the female participants were older than the male participants.
Older women had much less skeletal muscle mass than men. The choice of food may differ between men and women,26,27) as men tend to consume more beans and proteins containing fats than women, while women tend to consume more fruits and vegetables than men. This tendency may cause restrict protein intake in women, leading to a difference in ASM between the sexes.4)
Furthermore, functional dentition (NRT≥20) showed a negative relationship with SMI in females, unlike in males. Inui et al. also reported negative correlation between skeletal muscle mass and NRT in females only. Additionally, females presented lower mean skeletal muscle mass in class A group with good occlusal support which implies that occlusal support, as well as NRT, affects sarcopenia.28,29)
Some previous studies reported higher prevalence of sarcopenia in Korean men than in women when height adjusted skeletal muscle mass was used to define sarcopenia,30,31) because ASM adjusted by height showed an insignificant trend associated with age in female.32) The reason may be due to reduction in height in females due to osteoporosis after menopause.33)
A limitation of this study is its cross-sectional design, and the results do not indicate causal relationships. A second limitation is that gait speed or handgrip strength were unavailable, and therefore could not present the relationship between teeth loss and sarcopenia. Nevertheless, this study is based on a general population representative survey and is the first study to identify a correlation between oral health and ASM. Such correlation indicates that maintenance of oral health must be considered in managing skeletal muscle mass in older people.
In conclusion, this study showed a correlation between the NRT and SMI in participants ≥65 years of age in Korea. The relationship persisted in men, even after adjusting for confounders, but not in women.
Notes
The researchers claim no conflicts of interest.