Does Old Age Comprise Distinct Subphases? Evidence from an Analysis of the Relationship between Age and Activities of Daily Living, Comorbidities, and Geriatric Syndromes
Article information

Abstract
Background
Older individuals are usually treated as a homogenous group despite evidence that old age consists of distinct subphases. This observational study including 493 older patients aimed to identify differences among age subgroups of older persons. Receiver operating characteristic (ROC) curve analysis was then applied to identify the optimal age cutoff points to distinguish those age groups.
Methods
Data were collected on the demographics of older patients, their medical and medication histories, dependence on activities of daily living (ADLs), and instrumental activities of daily living (IADLs). Non-parametric tests (Kruskal–Wallis and Mann–Whitney U tests) and ROC curves were used for statistical analysis.
Results
The 65–79 and ≥80 years of age groups showed distinct frailty status, comorbidity, and dependency in ADLs. The median age to remain completely independent in IADLs was 76–79 years, while the median age for being free from geriatric syndromes was slightly higher (77–80 years) and reached 82 years for the absence of delirium, falls, and swallowing problems. In the ROC analysis, the optimal cutoff ages for the presence of frailty, cognitive impairment, and dependency in ADLs were 80–82 years.
Conclusion
The 65–79 and ≥80 years of age groups differed significantly in numerous parameters, underscoring the need to address these distinct age groups differently, both for applying medical therapies and interventions, as well as for conducting health research.
INTRODUCTION
Old age has been described as a heterogeneous phase comprising distinct subphases,1) even though it can be conceptualized as a single phase marked by constant quality.2) For example, Baltes and Smith1) proposed that age >80 years constitutes a separate life stage. Consistent with this statement, previous studies have demonstrated that people >80 years have significantly worse mobility,3) an increased risk of physical dysfunction,1) and more cognitive difficulties compared with younger age groups.4) However, the various age categorization terminologies employed in different studies limit the comparability of research findings.2)
For instance, Ouchi et al.5) argued that the current definition of older persons is no longer consistent with the development of changes in physical function brought on by aging and advocated designating individuals aged 65–74 and >75 years as pre-old and old, respectively. Furthermore, other studies have suggested that the 65–74 and ≥75 years of age groups differ in mental and physical health.6,7) The analysis of the surveys in these previous studies, initially divided the participants into age groups to explore age-related differences. In contrast, based on similarities in disease profiles and using clustering techniques, Geifman et al.8) investigated the feasibility of redefining age ranges and concluded that the 76–98 years of age group was distinct in terms of age-related diseases including Alzheimer disease, dementia, cataracts, and Parkinson disease. Chamberlain et al.9) found that the median frailty index increased monotonically across the 60–69, 70–79, and 80–89 years age groups, with increasing frailty being associated with higher risks of emergency department visits, hospitalization, and all-cause mortality. The frailty index assesses the decline in physiological reserve and function in multiple organ systems, measured by the accumulation of deficits such as the presence of comorbidities and limitations in activities of daily living (ADLs). Zheng et al.10) examined cognitive function trajectories in people aged 54–85 years, reporting that at the cohort level, cognitive functioning showed accelerating deterioration with age. Regarding disability in instrumental activities of daily living (IADLs), Sharashkina et al.11) found that the prevalence of IADL dependence increased significantly with age in adults >65 years. In particular, 82.3% of people over the age of 85 years showed dependence in IADLs, compared to only 33% and 54.2% of those aged 65–74 years and 75–84 years, respectively.
Geriatric syndromes are associated with a variety of other factors in addition to age, including unhealthy lifestyles (smoking and alcohol use), exercise, diet, functional impairment, history of falls, comorbid diseases, medication use, sex, economy, culture, marital status, living conditions, and medical payment.12-14) Additionally, the common risk factors for geriatric syndromes are causally related.15) Among these, older age is a common risk factor for geriatric syndromes.16-18) A literature review of the criteria and risk factors for geriatric syndromes identified age as one of four shared risk factors present in all geriatric syndromes examined.16) Furthermore, age was the most important risk factor in a study by Ni et al.14) that examined the factors influencing common geriatric syndromes.
Nevertheless, despite these reported age differences, most studies on older adults have classified and treated them as a homogenous and single group.19) Because diseases8) and geriatric syndromes15) in older adults vary according to age, these populations must be properly classified to make accurate diagnostic and therapeutic decisions and implement appropriate interventions.
In this study, we hypothesized that old age comprises different subphases. Therefore, we conducted this study to determine whether there were differences between age subgroups of older adults in terms of geriatric syndromes (e.g., cognitive impairment, falls, delirium, swallowing problems, polypharmacy, and sociability), comorbidity, and dependency in ADLs (e.g., bathing and dressing) and IADLs (e.g., cooking, housekeeping, shopping, and assistance in administering medications). Additionally, we used receiver operating characteristic (ROC) curve analysis to identify the optimal cutoff points for patient age to differentiate those experiencing cognitive impairment, frailty, and dependency in ADLs from those who do not.
MATERIALS AND METHODS
Sample and Data Collection
We conducted this observational study between September 2020 and December 2021 among patients ≥65 years of age who were consecutively admitted through the emergency department at the General and Oncological Hospital of Kifissia “Agioi Anargyroi.” Patients’ demographic information (age, sex, marital status, level of education, social interactions, living arrangements), comorbidities, number and type of medications taken, history of falls, delirium, swallowing problems, frailty, and cognitive status, and dependence in ADLs and IADLs were all collected at the time of admission. The first page of the survey included a cover letter explaining the study’s purpose and guaranteeing the participants’ confidentiality and anonymity in the final data report. After the patients were fully informed, one of the three research team members who collected the data asked them questions; in cases where patients were unable to communicate, their relatives provided written consent. Data regarding comorbidities, functional status, and cognitive status were obtained for the period before the onset of the illness that led to hospital admission. To estimate a score for frailty, cognitive status, comorbidity, and the ability to perform ADLs, the three research team members who collected the data interviewed the patients and/or their caregivers using relevant study measurements. The researchers completed the patient forms in an average of 30 minutes.
Study Instruments
We used the Barthel Index (BI) to assess how well the patients performed ADLs. The BI measures functional independence in ten areas of mobility and personal care on an ordinal scale ranging from 0 to 100, in which a higher score indicates a greater capacity to function independently.20) BI scores can be divided into four groups: no dependency (BI ≥95), mild-moderate dependency (BI 90–65), moderate-severe dependency (BI 60–25), and absolute dependency (BI ≤20).21)
The Global Deterioration Scale (GDS) is used to evaluate a patient’s cognitive status. The GDS is a seven-point scale, with 1 representing no cognitive decline and 7 representing extremely severe cognitive decline and dementia.22) We divided the GDS scores into three grades for subgroup analysis: no cognitive impairment (GDS 1), mild-moderate cognitive impairment (GDS 2–5), and severe-very severe cognitive impairment (GDS ≥6).23)
We assessed comorbidity using the Charlson Comorbidity Index (CCI). The CCI evaluates most significant medical comorbidities. Each of the 17 comorbidity categories, including age groups, was assigned a score ranging from 1 to 6. The individual scores of each patient were summed to obtain the total comorbidity score.24) Frailty status was assessed using both the revised nine-item Clinical Frailty Scale (CFS)25) and the Frail-VIG Index,23,26) where VIG is the Spanish/Catalan abbreviation for Comprehensive Geriatric Assessment. The CFS is a judgment-based frailty measure that assigns an overall fitness or frailty score to older adults, ranging from 1 (very fit) to 9 (terminally ill patients).25) The Frail-VIG Index is a simple tool based on a comprehensive geriatric assessment. It includes 22 questions (20 dichotomous and two scaled) that examine various parameters of frailty syndrome (performance of daily activities; nutrition; cognitive, emotional, and social functioning; the presence of geriatric syndromes; the presence of severe symptoms; and comorbidities).
Research Ethics
This study was conducted according to the ethical principles of the Declaration of Helsinki (revised in 2013). The Institutional Ethical and Scientific Committee of General and Oncology Hospital of Kifissia “Agioi Anargyroi” granted initial ethical approval for the study (Approval No. 1494; date, December 4, 2019). The second approval was obtained from the National and Kapodistrian University of Athens School of Medicine Committee on Bioethics and Deontology (Approval No. 284; date, May 25, 2020).
Also, this study complied the ethical guidelines for authorship and publishing in the Annals of Geriatric Medicine and Research.27)
Statistical Analysis
Categorical data are presented as counts and percentages. We applied the Shapiro–Wilk test to evaluate the normality of continuous variables. All continuous variables were skewed and expressed as medians and interquartile ranges (IQRs). Differences in mean ranks in CFS, Frail-VIG Index, CCI, and BI between age groups (65–69, 70–74, 75–79, 80–84, 85–89, and ≥90 years) were assessed using the Kruskal–Wallis test, the non-parametric analog of one-way analysis of variance for skewed data. Dunn’s pairwise tests were performed and adjusted using the Bonferroni correction for multiple testing. We also used Kruskal–Wallis tests to assess differences in patient age between categories based on walking aid use, cognitive deterioration, sociability, and dependency in some IADLs (e.g., shopping, cooking). We assessed differences in patient age between groups based on the presence of geriatric syndromes or the need for assistance in the remaining IADLs (assistance with financial matters or in preparing or administering medications) using the Mann–Whitney U test. p≤0.05 was considered statistically significant. The statistical analyses were performed using IBM SPSS Statistics for Windows, version 22.0 (IBM, Armonk, NY, USA).
We used receiver operating characteristic (ROC) curve analysis to determine the optimal cutoff points for patient age to distinguish (1) cases with mild-to-severe cognitive impairment from cases with no cognitive impairment, as measured by the GDS; (2) non-frail patients from patients with frailty, as measured by the CFS; and (3) functionally independent patients from patients with mild to severe dependency, as measured by the BI. The ROC analysis addressed each probability as a cutoff point for age. It estimated the proportion of patients with mild-to-severe cognitive impairment, frailty, or dependency in ADLs correctly classified as positive (true positive rate, sensitivity), and the proportion of patients with no cognitive impairment, frailty, or dependency correctly classified as negative (true negative rate, specificity). The ROC curves plotted the sensitivity (y-axis) against 1–specificity (x-axis). The area under the ROC curve (AUC) was used to discriminate between patients with mild-to-severe cognitive impairment, frailty, or dependency and those with no cognitive impairment, frailty, or dependency. The AUC values range from 0.5 (no diagnostic ability or prediction possible) to 1 (perfect diagnostic ability or prediction) and should be as large as possible. An AUC value of 0.9–1.0 represents outstanding discrimination, 0.8–0.9 excellent, 0.7–0.8 acceptable, 0.7–0.5 poor, and ≤0.5 failing discrimination.28) We applied statistical tests to determine whether the AUC differed significantly from 0.5, which corresponds to an AUC plot of the 45° diagonal line and represents a random classification. We performed the ROC curve analysis and optimal cutoff point selection in the diagnostic tests using the Optimal Cutpoints package in R.29)
RESULTS
During the study period, 504 patients aged ≥65 years were admitted to the emergency department of the hospital. Six patients (three men and three women) were unwilling to participate in the study. Five patients (three men and two women) were unable to communicate and their caregivers (one man and four women) refused to participate in the study. Finally, we enrolled 493 patients in this study. The median age of the patients was 82 years (IQR, 75–88 years). Among these participants, 239 were women (48.5%) and 254 were men (51.5%). The characteristics of the participants are presented in Table 1.
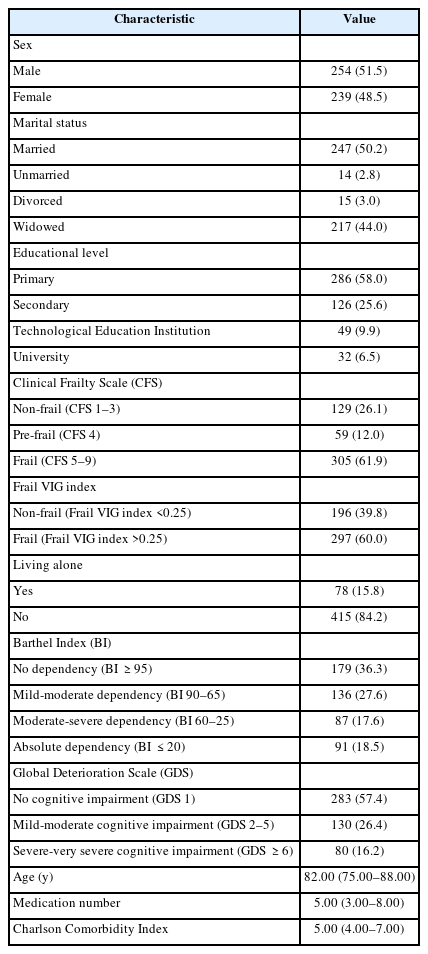
Participants’ characteristics (n=493)
Examining of the differences in frailty status, comorbidity, and dependency in ADLs across the age groups demonstrated minor differences in three groups of older patients (65–69, 70–74, and 75–79 years); therefore, we categorized them into a single group. After 80 years of age, the age groups showed more significant differences in most cases (Table 2).
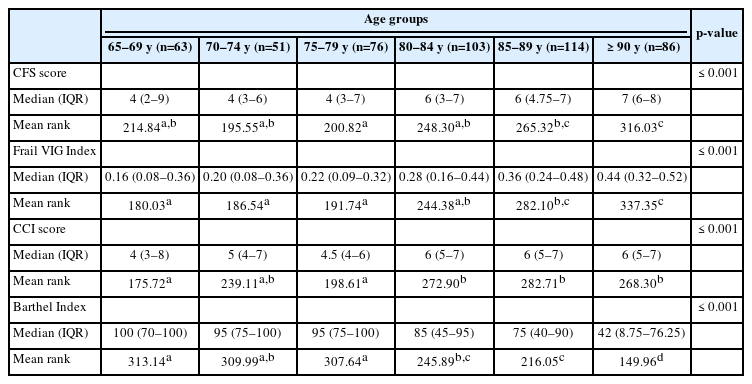
Differences in CFS, Frail VIG Index, CCI, and Barthel Index across subgroups of older adults based on age (n=493)
Age differed significantly between participants who did and did not require assistance in IADLs and who presented with and without any geriatric syndrome. More specifically, those needing assistance with IADLs differed significantly in age from those who did not. The median ages for assistance from another adult and independence in the examined activities were 82–85 years and 76–79 years, respectively. Moreover, patients with geriatric syndromes differed significantly in median age from those without such syndromes (77–82 years for the absence of geriatric syndromes vs. 83–86 years for the presence of geriatric syndromes) (Table 3).
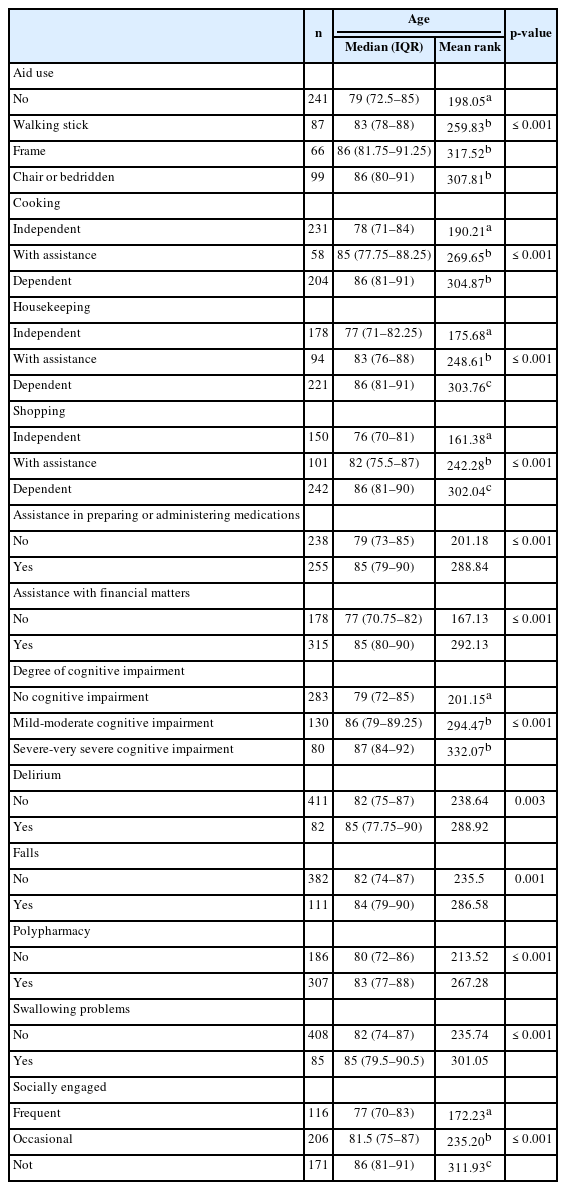
Differences in mean rank for age groups of older adults based on the presence of geriatric syndromes and the dependency on instrumental activities of daily living (n=493)
ROC Analysis
Using the Optimal Cutpoints package in R, patient age displayed acceptable diagnostic accuracy or ability to discriminate between patients with mild-to-severe cognitive impairment and patients without cognitive impairment, with an AUC of 0.718, standard error (SE) of 0.023, z-statistic of 9.387, p<0.001, and 95% confidence interval (CI) of 0.673–0.764. Thus, the probability that the age of a patient drawn at random from the population with a positive condition (mild-to-severe cognitive impairment) was greater than that of another individual drawn at random from the population with a negative condition (no cognitive impairment) was 0.718. Implementing a criterion derived from the generalized Youden index, assuming a 50% prevalence rate of mild-to-severe cognitive impairment in the patient population, and considering that a false negative (FN) outcome was as costly as a false positive (FP) outcome, the optimal cutoff point for patient age was 82 years. Fig. 1 presents the Youden’s metric function values for each age cutoff. This metric, which is used to assess the discriminatory ability of a cutoff point, relies on maximizing the Youden index (sensitivity + specificity – 1). The same age threshold was indicated by the maximum efficiency method for selecting optimal cutoffs, which maximized the efficiency or accuracy. The ROC curve is shown in Fig. 1.
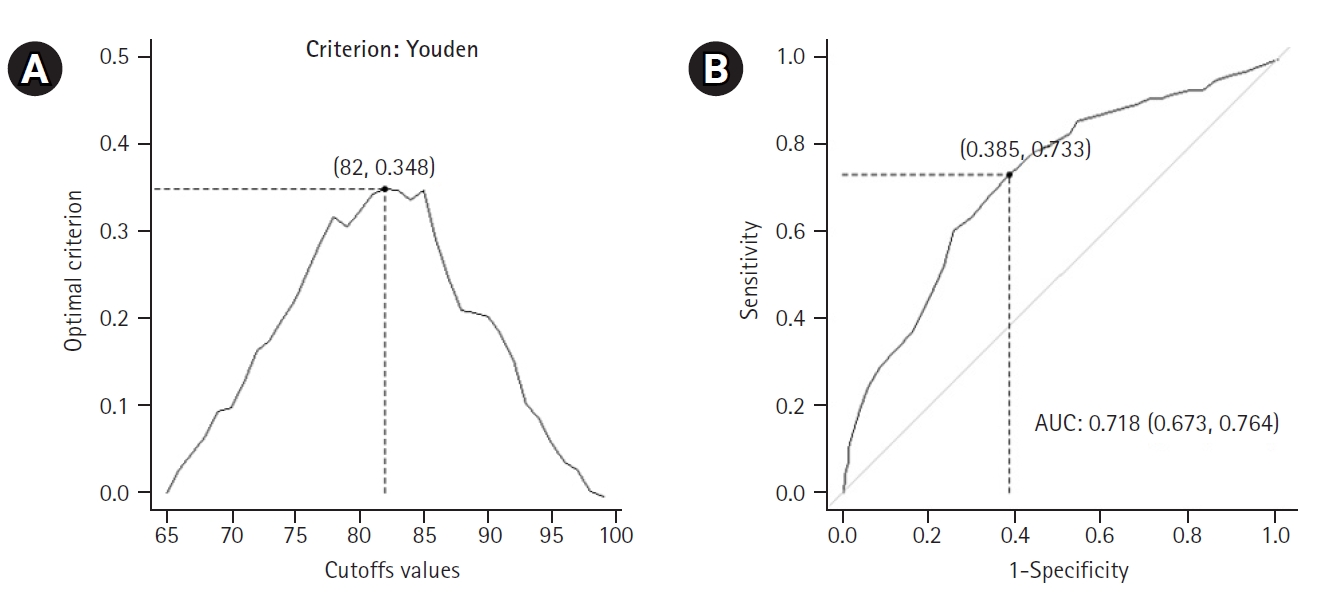
Receiver operating characteristic (ROC) curve analysis for patients with cognitive impairments: (A) values of the Youden’s metric function per age cutpoint (optimal value with coordinates) and (B) ROC curve, together with the optimal cutoff point for age and area under ROC curve (AUC), with 95% confidence interval.
Using this cutoff age, we created a 2×2 table that included the disease status (negative, with no cognitive impairment vs. positive, with mild-to-severe cognitive impairment) and the test result (positive, age >81 years; negative, age ≤81 years). Based on patient age, this allowed us to correctly classify 61.5% of patients without cognitive impairment (specificity or true negative rate) and 73.3% of patients with mild-to-severe cognitive impairment (sensitivity or true positive rate) (Table 4).
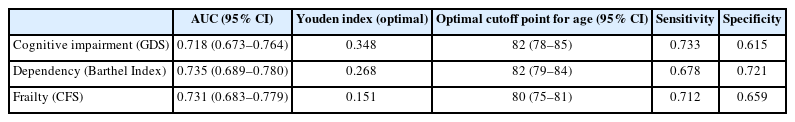
AUC, sensitivity, specificity, Youden index (optimal), and optimal cutoff thresholds (with 95% CI) for age distinguishing patients with and without mild to severe cognitive impairment, dependency, and frailty
Furthermore, 69.7% of patients with a negative test result (i.e., age ≤81 years) did not present with mild-to-severe cognitive impairment, while 65.6% of patients with a positive test result (i.e., age >81 years) did present with mild-to-severe cognitive impairment. The probability of a patient with mild-to-severe cognitive impairment having a positive test result was 0.656 (positive predictive value), representing an approximately 16% increase in the probability of the disease in the presence of a positive test. Similarly, the probability of a patient with mild-to-severe cognitive impairment having a negative test result was 0.303 (equal to 1–0.697; negative predictive value), which was associated with an approximately 20% decrease in the probability of disease in the presence of a negative test.
Regarding dependency, implementing a criterion derived from the generalized Youden index, assuming a 55% prevalence rate of mild-to-severe dependency in the patient population, and considering that an FN outcome was as costly as an FP outcome, the optimal cutoff for patient age was 82 years. Fig. 2 presents the Youden’s metric function values for each age cutoff. The same threshold was indicated by the MaxEfficiency method for selecting optimal cutoffs that maximized efficiency or accuracy. The ROC curves are shown in Fig. 2. The AUC was 0.735 (SE=0.023, z-statistic=10.150, p<0.001, 95% CI 0.689–0.780).
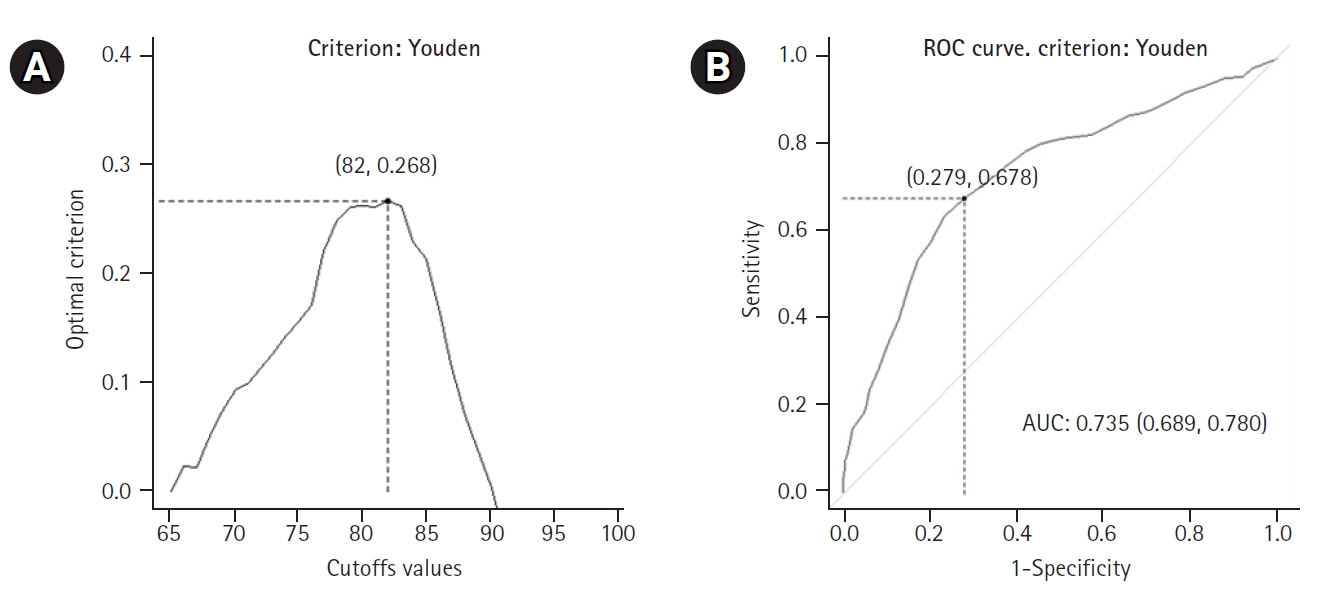
Receiver operating characteristic (ROC) curve analysis for patients with dependency: (A) values of the Youden’s metric function per age cutpoint (optimal value with coordinates) and (B) ROC curve, together with the optimal cutoff point for age and area under ROC curve (AUC), with 95% confidence interval.
Accordingly, we used this cutpoint to develop a 2×2 table that included the disease status (negative, with no dependency vs. positive, with mild to severe dependency) and the test result (positive, age >81 years; negative, age ≤81 years). Based on patient age, we correctly classified 72.1% of patients with no dependency (specificity or true negative rate) and 67.8% of patients with mild-to-severe dependency (sensitivity or true positive rate) (Table 4). Furthermore, 64.7% of patients who registered a negative test result (i.e., age ≤81 years) did not present with mild to severe dependency, while 74.8% of patients with a positive test result (i.e., age >81 years) did, in fact, present with mild to severe dependency. In terms of probabilities, the probability of a patient with mild-to-severe dependency having a positive test result was 0.748 (positive predictive value), representing an approximately 20% increase in the probability of the disease in the presence of a positive test. Similarly, the probability of a patient with mild-to-severe dependency having a negative test result was 0.353 (=1–0.647, the latter value being the negative predictive value), which was associated with an approximately 20% decrease in the probability of the disease in the presence of a negative test.
Finally, regarding frailty, using a criterion derived from the generalized Youden index, assuming a 60% prevalence rate of frailty in the patient population, and considering that an FN outcome was as costly as an FP outcome, the optimal cutoff for patient age was 80 years. Fig. 3 presents the Youden’s metric function values for each age cutoff. We obtained the same threshold using the maximum efficiency method. The ROC curves are shown in Fig. 3. The AUC was 0.731 (SE=0.024, z-statistic=9.450, p<0.001, 95% CI 0.683–0.779).

Receiver operating characteristic (ROC) curve analysis for patients with frailty: (A) values of the Youden’s metric function per age cutpoint (optimal value with coordinates) and (B) ROC curve, together with the optimal cutoff point for age and area under ROC curve (AUC), with 95% confidence interval.
Applying this cutpoint, we created a 2×2 table between disease status (negative, non-frail patients vs. positive, frail patients) and test result (positive, age >79 years; negative, age ≤79 years). This allowed us to correctly classify 65.9% of patients with no frailty (specificity or true negative rate) and 71.2% of patients with frailty (sensitivity or true positive rate) based on patient age (Table 4). Furthermore, 60.4% of patients with a negative test result (i.e., age ≤79 years) did not present with frailty, while 75.8% of patients with a positive test result (i.e., age >79 years) presented with frailty. The probability of a patient with frailty having a positive test result was 0.758 (positive predictive value), representing an approximately 16% increase in the probability of disease in the presence of a positive test result. Similarly, the probability of a patient with frailty having a negative test result was 0.396 (=1–0.604), which was associated with an approximately 20% decrease in the probability of disease in the presence of a negative test.
DISCUSSION
The results of our study demonstrated that the age groups of 65–79 and ≥80 years of age groups differed in frailty status, comorbidity, and dependency in ADLs. Specifically, we observed that individuals aged 76–79 years included the median age at which individuals remained fully independent in IADLs. The median age for being free of geriatric syndromes was slightly higher, at 77–80 years. Notably, delirium, falls, and swallowing problems were not observed until 84–85 years of age. The results of the ROC analysis indicated an optimal age cutoff for the presence of frailty, cognitive decline, and dependency in ADLs of 80–82 years. However, the possibility of being frail, dependent, or having a cognitive decline in the preceding age group (i.e., 65–79) also exists. This fact does not affect our conclusion, given that frailty, dependency on ADLs, and cognitive decline are also present in middle-aged individuals (50–65 years old).30-33)
Our findings are consistent with the idea that old age comprises distinct subphases.1) These subphases were distinguished by an 80-year age limit. Some authors1,3,4) concur with this age limit; others have reported a cutoff of 75 years.5-8) This observation is clinically significant. The difficulty of treating older individuals as a homogenous group is reflected in the Australian clinical guidelines. Three of the 20 reviewed guidelines define “older people” by chronological age, while the remaining 17 do not define “older people” at all.34) Moreover, the 2018 American Heart Association/American Stroke Association guidelines do not suggest an upper age limit for endovascular thrombectomy but recommend considering comorbidities when making relevant decisions.35) Understanding age-related differences and appropriately categorizing older adults may help in decision-making in the healthcare sector in terms of medication use,36) cancer screening,37) organ donation and transplantation,38) therapeutic interventions,35,39) and medical research.40)
Finally, acknowledging that older adults are a heterogeneous group and that the 65–79 and ≥80 years of age groups are distinct may help medical staff access patients not primarily based on their age but also by considering their cognitive ability, frailty status, and functional independence. Our results highlight the need for greater attention to diversity in aging, recognizing different ways of aging and different ages. Simplifying the identification of patients >65 years of age into a single “older people” category encourages inaccurate medical judgments and over- and under-treatment.41,42) A positive mindset should be cultivated regarding aging as a new stage of life, where healthcare should be personalized according to specific patient needs, preferences, functioning, limitations, and life expectancies. It may be possible to improve older people’s access to healthcare, increase the quality of care they receive, and enhance their mental health, by not treating them negatively because they are uniformly perceived as “old.” Fighting ageism (i.e., stereotypes, discrimination, and prejudice against older people) can optimize appropriate prescription, improve medication adherence, reduce polypharmacy, apply proper treatments, implement timely interventions, and promote equitable inclusion of older people in research studies and surveillance data.43,44)
Aging is a process that begins early in life, before 65 years of age, and results in many changes across the body's systems that require special attention and management.45) Applying proper dietary, behavioral, and pharmaceutical interventions may delay the aging process and increase the healthy lifespan.46) These preventive interventions may vary depending on age group, and future studies should demonstrate which interventions are appropriate for each age group. For example, interventions to delay frailty should be more suitable for people aged 65–79 years, whereas coping strategies regarding aging and death should be more appropriate for adults aged ≥80 years.47,48)
One strength of this study is our use of a variety of multifaceted criteria, including frailty status, cognitive function, and ADL, to effectively demonstrate the diverse age-related characteristics of older patients. The main limitation of our study is that the study sample consisted of individuals who were consecutively admitted to the hospital through the emergency department. Consequently, our findings regarding the age cutoff points for identifying geriatric syndromes and difficulties in IADLs cannot be generalized to the entire population of older people. Future research should be conducted on a wider range of people in the community. Second, we did not include people from younger age groups (i.e., 50–64 years) for comparison with the 65–80 years of age group to identify any differences in the investigated parameters. Future research in different countries with larger and more representative samples may establish more precise, unambiguous, and definitive age thresholds for the classification of older adults. Nevertheless, these thresholds may differ between countries, as perceptions regarding aging are culturally sensitive, even though they are not based on strict scientific data but only on personal beliefs. For example, people in Greece believe that youth ends at around 52 years of age and that old age begins at 68, whereas Norwegians think that youth ends around 34 years of age, and British and Turkish individuals believe that old age begins at 59 and 55 years of age, respectively.49)
In conclusion, notwithstanding these limitations, the current study results add to the existing body of literature by demonstrating the significant differences in several parameters between the 65–79 and ≥80 years of age group. This finding emphasizes the need for different approaches in these two age groups when applying medical therapies and interventions, as well as when conducting health research.
Notes
CONFLICT OF INTEREST
The researchers claim no conflicts of interest.
FUNDING
None.
AUTHOR CONTRIBUTIONS
Conceptualization, IV, FA, PV, DN; Data curation, IV, FA, PV, AK; Formal analysis, FA; Investigation, IV, FA, PV, AK, DT; Methodology, IV, FA, PV, AK, DT; Visualization, FA, DT; Project administration, FA, DN; Supervision, FA, DN; Writing-original draft, IV, FA; Writing-review & editing, IV, FA, PV, DT, DN.