Case-Finding for Sarcopenia in Community-Dwelling Older Adults: Comparison of Mini Sarcopenia Risk Assessment with SARC-F and SARC-CalF
Article information

Abstract
Background
We compared the diagnostic performance of the short five-item and full seven-item Mini Sarcopenia Risk Assessment Questionnaire (MSRA-5 and MSRA-7) against the Strength, Assistance walking, Rise from a chair, Climb stairs, and Falls (SARC-F) and SARC-F with calf circumference (SARC-CalF) scales for sarcopenia in healthy community-dwelling older adults.
Methods
We conducted a post-hoc cross-sectional secondary data analysis of a prospective cohort study, using data from 230 older adults (mean age 67.2±7.4 years, 92% Chinese, and 73% female) from the “Longitudinal Assessment of Biomarkers for characterization of early Sarcopenia and Osteosarcopenic Obesity in predicting frailty and functional decline in community-dwelling Asian older adults Study” (GeriLABS-2) conducted between December 2017 and March 2019 in Singapore. We performed receiver operating characteristic curve analysis to ascertain the area under the curve (AUC) for sarcopenia diagnosis using the Asian Working Group for Sarcopenia 2019 consensus criteria. We applied the DeLong method to compare the AUCs of the four instruments.
Results
The MSRA-5 and MSRA-7 demonstrated poor diagnostic performance (AUC of 0.511, 95% confidence interval [CI] 0.433–0.589 and AUC of 0.526, 95% CI 0.445–0.606, respectively), compared to that in SARC-CalF (AUC of 0.739, 95% CI 0.671–0.808) and SARC-F (AUC of 0.564, 95% CI 0.591–0.636). The SARC-CalF demonstrated significantly superior discriminatory ability compared to that in the SARC-F, MSRA-5, and MSRA-7 (all p<0.01). The MSRA-5 demonstrated lower sensitivity (0.464) and specificity (0.597) than in the SARC-CalF (0.661 and 0.738, respectively), whereas the MSRA-7 had higher specificity (0.887) and lower sensitivity (0.145).
Conclusion
The poor diagnostic performances of the MSRA-5 and MSRA-7 in our study suggest limitations of self-reported questionnaires for assessing general and dietary risk factors for sarcopenia in healthy and culturally diverse community-dwelling older adults. Studies in different populations are needed to ascertain the utility of the MSRA for the community detection of sarcopenia.
INTRODUCTION
Sarcopenia, an age-related, progressive, and generalized skeletal muscle disorder,1) is associated with adverse health and health utilization outcomes, including falls,2) health-related quality of life,3) hospitalization, healthcare costs,4) and mortality.5) The Asian Working Group for Sarcopenia (AWGS) 2019 consensus1) updated the diagnostic algorithm for sarcopenia to emphasize case findings for the early identification of people at risk for sarcopenia in community settings without access to advanced diagnostic equipment.1) The AWGS 2019 recommends calf circumference, Strength, Assistance walking, Rise from a chair, Climb stairs, and Falls (SARC-F), and SARC-F with calf circumference (SARC-CalF) scales as case findings in community settings.
Three self-report questionnaires have been validated for community case findings of sarcopenia. The SARC-F,6) a five-item questionnaire, is characterized by low sensitivity and high specificity.7-9) The SARC-CalF10) measures calf circumference in addition to the SARC-F, with studies suggesting improved sensitivity. More recently, the Mini-Sarcopenia Risk Assessment Questionnaire (MSRA) was validated in an Italian population of community-dwelling older adults.11) Unlike the SARC-F and SARC-CalF, the MSRA evaluates self-reported general and nutritional risk factors for sarcopenia. The two versions of the MSRA are the full seven-item version (MSRA-7) and a short five-item version (MSRA-5), omitting the two questions on dairy and protein intake. The original validation study developed the short version after dairy and protein intake items were not associated with sarcopenia.
Compared with the SARC-F, which is a self-reported screening tool with low sensitivity, and the SARC-CalF, which requires calf circumference measurement, the MSRA purports to be a self-reported questionnaire with higher sensitivity that does not require additional measurements. Thus, whether the MSRA is a good screening test in addition to the current repertoire of screening tools warrants investigation. In two Asian studies involving frail older adults from assisted-living facilities and nursing homes,12) the SARC-CalF demonstrated significantly better diagnostic performance for sarcopenia than in the MSRA-5, MSRA-7, and SARC-F. Three studies examined the use of the MSRA-5 and MSRA-7 among community-dwelling older adults in Poland,13) China,14) and Thailand,15) respectively. In the Polish study, the SARC-CalF had the best diagnostic performance compared to that in the MSRA-5, MSRA-7, and SARC-F. In the Chinese and Thai studies, the MSRA-5 and MSRA-7 demonstrated higher sensitivity but lower specificity than in the SARC-F. In all three studies, the MSRA-5 had a better diagnostic performance for sarcopenia than in the MSRA-7, alluding to possible cultural influences attenuating the utility of the nutritional questions.
To better evaluate the effectiveness of the MSRA as a community case-finding tool for sarcopenia, we must understand its utility in diverse settings. First, studies examining the diagnostic performance of the MSRA-5 and MSRA-7 in healthy community-dwelling older adults, in whom early detection of sarcopenia may arguably be even more critical, are lacking. In previous studies involving community-dwelling older adults,13-15) the average gait speed was less than the AWGS 2019 recommended cut-off of 1 m/s, suggesting that participants may be less robust despite community-dwelling. A Thai study involving participants recruited from a medical outpatient clinic reported a higher prevalence of sarcopenia (22.7%), with 69.6% of participants having a gait speed of <1 m/s. Secondly, it is important to ascertain if the attenuated performance of the MSRA-7 vis-à-vis the MSRA-5 applies to other Southeast Asian populations, where the diet does not typically include the regular consumption of dairy products. This provided the impetus for our study, which examined and compared the diagnostic performance of the MSRA-5 and MSRA-7 with the SARC-F and SARC-CalF among healthy community-dwelling older adults in Singapore.
MATERIALS AND METHODS
Study Population
We performed a post-hoc cross-sectional secondary data analysis of the “Longitudinal Assessment of Biomarkers for characterization of early Sarcopenia and Osteosarcopenic Obesity in predicting frailty and functional decline in community-dwelling Asian older adults Study” (GeriLABS-2). The GeriLABS-2 is a prospective cohort study involving cognitively intact and functionally independent community-dwelling adults aged 50 years and older in Singapore. The study design has been previously described.16,17) Briefly, the inclusion criteria were (1) age 50–99 years at study enrollment, (2) community dwelling, and (3) independence in both basic and instrumental activities of daily living (IADL). The exclusion criteria were cognitive impairment (prior diagnosis of dementia or modified Chinese version of the Mini-Mental State Examination [mCMMSE] score ≤2118)), inability to walk 8 m independently, or being a resident in long-term residential care. Ethical approval was obtained from the domain-specific review board of the National Healthcare Group (NHG DSRB Reference: 2017/00850). Also, this study complied the ethical guidelines for authorship and publishing in the Annals of Geriatric Medicine and Research.19)
Data Collection
Demographic data, anthropometric measurements (standing height, body weight, calculated body mass index, and calf circumference), and cardiovascular health data were collected. Cognition was assessed using the mCMMSE.18) Functional status was assessed using the Barthel activities of daily living (ADL) index20) and the Lawton and Brody IADL index.21) Physical function was assessed using the Short Physical Performance Battery (SPPB), maximal hand grip strength using a hydraulic hand dynamometer, usual gait speed on the 3-m walk test, and the five-time chair-stand test. Other questionnaires obtained at baseline included the Mini Nutritional Assessment (MNA)22) and the Frenchay Activity Index (FAI).23) The AWGS 2019 consensus criteria1) were used to diagnose sarcopenia. This required the presence of (1) low muscle strength (<28 kg for men and <18 kg for women measured using a hydraulic hand dynamometer (North Coast Exacta Hydraulic Hand Dynamometer; North Coast Medical Inc., Morgan Hull, CA, USA) and/or low physical performance (as measured by usual gait speed <1.0 m/s on the 3-m walk test) and (2) low muscle mass. As previously described,17) we measured the height-adjusted appendicular lean mass using dual-energy X-ray absorptiometry (DXA) (Discovery APEX 13.3; Hologic, Bedford, MA, USA). Frailty was assessed using the Fatigue, Resistance, Ambulation, Illness, and Loss of weight (FRAIL) scale, a five-item self-report questionnaire,24) and the modified Fried phenotypic criteria, a five-item scale comprising both self-report items and objective measurements.25,26)
MSRA Questionnaire
The Chinese version of the MSRA27) (Table 1) comprises seven items in two broad categories: (1) general assessment (four questions evaluating participant age, activity level, hospitalization, and weight loss) and (2) dietary assessment (three questions evaluating the consumption of protein and dairy and the number of meals).11) Items #1–7 are scored and summed up to a total of 0–40 points for the MSRA-7 questionnaire, while Items #1–4 and 7 are scored and summed up to a total of 0–60 points for the MSRA-5 questionnaire. Participants with scores of ≤30 or ≤45 points are considered at risk for sarcopenia using the MSRA-7 and MSRA-5, respectively.
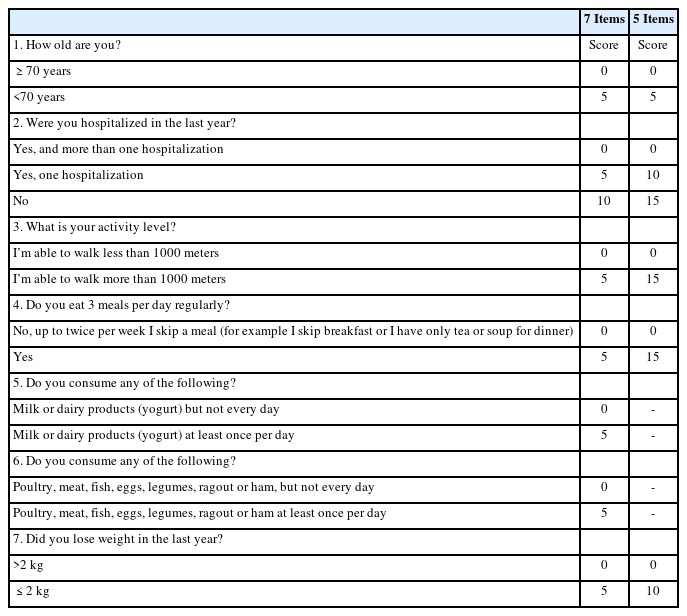
The Mini Sarcopenia Risk Assessment 7 and 5 items (MSRA-7 and MSRA-5) questionnaires
As the MSRA was not directly administered to the participants at the time of enrolment, appropriate questions available from the baseline data were approximated to the MSRA. Question #3 of the MSRA, which evaluates the activity level of participants, was approximated using the FAI item “In the last 3 months, how often have you walked outside for >15 minutes?” Question #4, which evaluated a participant’s number of daily meals, was approximated using the MNA item, “How many full meals do you eat daily?” Questions #5 and #6, which evaluated a participant’s dairy and protein intake, respectively, were approximated using the respective components of the MNA item, which asked participants whether they consumed dairy or protein daily. Question #7, which evaluated a participant’s weight loss, was approximated using the MNA item, which asked participants if they had experienced involuntary weight loss during the last 3 months.
Statistical Analyses
All analyses were performed using R statistical software (v4.2.1; https://www.R-project.org). Descriptive statistics were calculated using the gtsummary package (v1.1.6).28) Receiver operating characteristic (ROC) curve analysis was performed using the plotROC package (v2.3.0),29) and cut-off points were obtained using the OptimalCutpoints package (v1.1.5).30) All statistical tests were two-tailed, with p<0.05 considered statistically significant.
ROC curve analysis was performed to ascertain the area under the curve (AUC), using the AWGS 2019 diagnostic criteria as the reference standard. The DeLong method was used to compare the AUCs of the four instruments. The sensitivity, specificity, positive and negative predictive values, and positive and negative likelihood ratios were calculated. We derived the optimal cut-off points using the Youden Index, which was compared with the validated cut-offs in the original study.
RESULTS
We analyzed the data of 230 participants with a mean age of 67.2±7.4 years, education of 10.8±4.4 years, and mCMMSE score of 26.1±1.7. The participants were predominantly female (73%) and of Chinese ethnicity (86% males, 95% females). The women were younger (mean age 66±7 years) compared to men (mean age 69±8 years) (Table 2). Overall, the participants were functionally independent, with a mean Barthel's score for basic ADL of 98.1±3.3 and Lawton's score for IADL of 22.7±0.5. In this study, 23% and 38% of female and male participants, respectively, met the AWGS 2019 consensus criteria for sarcopenia. The prevalence rates of participants who were classified as robust, prefrail, and frail were 52%, 44%, and 3.9% for the modified Fried scale and 85%, 15%, and 0% for FRAIL, respectively. The high average gait speed (1.17±0.23 m/s) and low prevalence of frailty (3.9% for Fried and 0% for FRAIL) reflected the relatively robust health of the study participants. The mean SARC-F, SARC-CalF, MSRA-5, and MSRA-7 scores were 0.45±0.74, 3.3±4.5, 58.0±9.0, and 33.0±4.8, respectively.

Baseline characteristics of GeriLABS-2 patients
Table 3 shows the results of comparisons of the diagnostic performances of the sarcopenia case-finding tools with the AWGS 2019 diagnostic criteria. The SARC-CalF demonstrated the highest discriminatory ability compared to the other three case-finding tools, with an AUC of 0.739 (95% confidence interval [CI] 0.671–0.808) (all p<0.001). Conversely, the MSRA-5 and MSRA-7 did not perform well, with AUCs of 0.511 (95% CI 0.433–0.589) and 0.526 (95% CI 0.445–0.606), respectively. The SARC-F had an AUC of 0.636 (95% CI 0.591–0.636). The AUCs of the SARC-F, MSRA-5, and MSRA-7 did not differ significantly (p=0.308 SARC-F vs. MSRA-5; p=0.449 SARC-F vs. MSRA-7; p=0.614 MSRA-5 vs. MSRA-7) (Fig. 1).
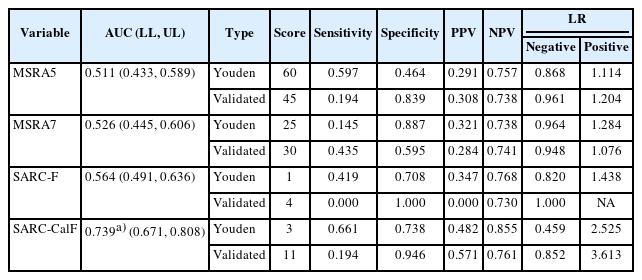
Comparison of the four case-finding tools
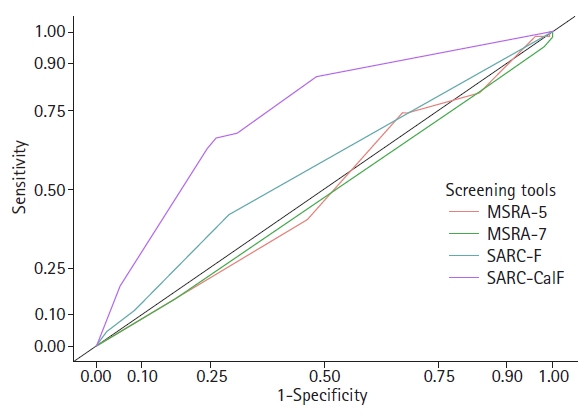
Receiver operating characteristic curve of the four sarcopenia screening tools. MSRA-5, Mini-Sarcopenia Risk Assessment Questionnaire 5 items; MSRA-7, Mini-Sarcopenia Risk Assessment Questionnaire 7 items; SARC-F, Strength, Assistance walking, Rise from a chair, Climb stairs, and Falls; SARC-CalF, SARC-F with calf circumference.
Using the Youden index, the SARC-CalF demonstrated the highest sensitivity (0.661) and specificity (0.738). The MSRA-7 had a higher specificity (0.887) but lower sensitivity (0.145), whereas the MSRA-5 had a comparable sensitivity (0.597) but a lower specificity (0.464). The SARC-CalF demonstrated the highest positive likelihood ratio (2.525) and the lowest negative likelihood ratio (0.459). Both the MSRA-5 and MSRA-7 had lower PPV and NPV than those in the SARC-F and SARC-CalF.
Comparison of the validated cut-off points of the four case-finding tools to the Youden cut-off points revealed optimal cut-off points for the MSRA-5, SARC-F, and SARC-CalF that were more inclusive than the validated cut-off points, reflecting the more robust profile of our study participants. For example, participants were considered to be at high risk for sarcopenia if their MSRA-5 score was <60 using the Youden cut-off point compared to the validated cut-off point of 45.11) Only the MSRA-7 demonstrated a more stringent threshold, with a Youden cut-off of 25, compared with the validated cut-off point of 30.11) None of the participants scored >3 on the SARC-F, which has a validated cut-off point of 4.6)
Table 4 summarizes the individual responses to the MSRA-5 and MSRA-7 questionnaires analyzed for the presence of sarcopenia according to the AWGS19 diagnostic criteria. Of the seven questions, only Question #1, which evaluates age, differed significantly between those with and without sarcopenia (p<0.01). Question #7, which evaluated weight loss, tended towards statistical significance (p=0.087). However, Questions #2–6 demonstrated no differences between participants with and without sarcopenia.
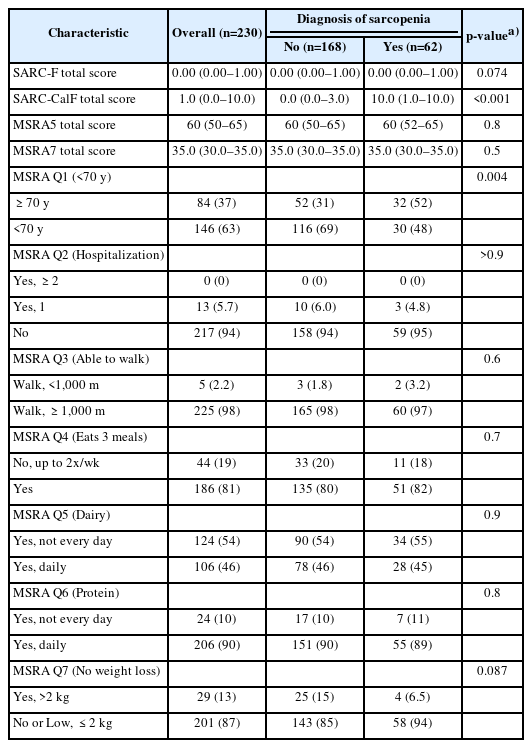
Comparison of individual questions of MSRA
DISCUSSION
Early detection via community case-finding is crucial for identifying patients with sarcopenia.1) Our study findings build upon the existing body of evidence by examining the diagnostic performance of the MSRA among healthy community-dwelling older adults in a Southeast Asian population. Unlike earlier studies in less robust older adults,12,31) our results suggest that, compared to the SARC-CalF and the SARC-F, MSRA5 and MSRA7 did not perform well in community case detection. Furthermore, the MSRA-5 had lower sensitivity, negative predictive value, and negative likelihood ratio than in the SARC-F or SARC-CalF, suggesting that it is likely to miss participants with sarcopenia. The MSRA-5 had lower specificity, positive predictive value, and positive likelihood ratio than those in the SARC-F or SARC-CalF, suggesting that it will likely result in more false-positive findings. Our study did not replicate the results of earlier studies, in which the MSRA-5 demonstrated better diagnostic performance than in the MSRA-7.14)
The unsatisfactory diagnostic performance of the MSRA questionnaires in our study indicates the diagnostic limitations of the MSRA questionnaire in healthy populations. Furthermore, the cut-offs validated in the original study differed from the derived cut-offs in our population, with our cut-offs generally lower thresholds for identifying sarcopenia, further corroborating the limitations of the MSRA as a screening tool in more robust older adult populations. This may be attributed to two factors. First, the questions may not directly reflect the risk of sarcopenia. While the SARC-F questions are based on the assessment of muscle strength, physical performance, and calf circumference, which adds a measure of muscle mass, the MSRA questions do not directly evaluate the components of sarcopenia. Instead, they evaluate the general and dietary risk factors that may contribute to the development of sarcopenia. This finding is particularly pertinent in the context of the relatively robust spectrum of older adults enrolled in our study. In our study, most healthy older adults scored well on the MSRA components. For instance, 98% of the participants could walk 1,000 m, while 90% ate protein. The analysis of the individual component questions of the MSRA highlights that the MSRA questions may lack discriminatory ability for participants with and without sarcopenia.
Furthermore, in the Southeast Asian context, sociocultural influences on dietary questions may attenuate the utility of the MSRA as a sarcopenia case-finding tool. For instance, the consumption of milk or dairy products is relatively low among older people in Singapore. Up to 54% of older adults in our study did not eat dairy daily, in contrast to >90% who reported daily dairy intake in the original validation study conducted in Italy,11) highlighting the salience of cultural differences in the dietary habits of older adults. The low base rate of dairy intake may attenuate the discriminatory ability of the questions in identifying the risk of sarcopenia in our participant population, who may have nutritional statuses and dietary norms different from those of older adults in Western countries.32,33)
The diagnostic performances did not differ between the MSRA-5 and MSRA-7 in this study. This finding is in contrast to three earlier studies that examined the use of the MSRA-5 and MSRA-7 in community-dwelling older adults,13) wherein the MSRA-5 demonstrated better diagnostic performance with higher specificity for sarcopenia than in the MSRA-7. The specificity of the MSRA-5 was lower than that of the MSRA-7 in our study, suggesting its diminished ability to rule out false-positive cases. This is likely attributable to the higher cut-off (<60) for the MSRA-5 in our study population, comprising participants who were younger, more robust, and with less impaired MSRA-5 and MSRA-7 scores. This suggests that excluding dairy and protein intake items from the MSRA-5 may not confer an advantage in diagnostic performance in more robust older adult populations.
In summary, our results highlight the limitations of the MSRA as a sarcopenia case-finding tool in a relatively robust Southeast Asian population. However, these results have certain limitations. First, the selection of a relatively healthy Asian population limits the generalizability of the results to less robust or non-Asian populations. Further studies should be conducted in diverse populations to ascertain the applicability of our findings to populations with different characteristics. Additionally, the MSRA questionnaires were not administered directly to the participants. Responses were approximated from other questionnaires, which may have impacted the accuracy of the responses obtained and reduced the diagnostic accuracy of the MSRA. Finally, while the original study was a longitudinal prospective cohort study of community-dwelling older adults, this was a cross-sectional secondary data analysis at the time of enrollment. Ongoing studies are exploring the predictive validity of the MSRA as a screening tool and its longitudinal association with the incidence of sarcopenia.
In conclusion, our study demonstrated the diagnostic limitations of the MSRA-5 and MSRA-7 for detecting sarcopenia in relatively healthy community-dwelling older adults in a Southeast Asian population. Among the four case-finding tools for sarcopenia, the SARC-CalF showed the best diagnostic performance in identifying sarcopenia in this population. Compared to the SARC-CalF, the MSRA-5 had comparable sensitivity but lower specificity, whereas the MSRA-7 had comparable specificity but lower sensitivity. The diagnostic performance did not differ between the MSRA-5 and MSRA-7.
Notes
CONFLICT OF INTEREST
The researchers claim no conflicts of interest.
FUNDING
This research was funded by the Lee Foundation Grant 2019. The funder had no role in the design of the study; in the collection, analyses, or interpretation of data; in the preparation of the manuscript, or the review or approval of the manuscript, and in the decision to publish the results.
AUTHOR CONTRIBUTIONS
Conceptualization, SC, JQC, WSL; Data curation, SC, WSL; Funding acquisition, WSL; Investigation, SC, WSL; Methodology, SC, JQC, ESL; Project administration, SC, WSL; Supervision, WSL; Writing-original draft, SC; Writing-review & editing, JQC, JC, JPL, WSL.