Perceived Stress and Frailty in Older Adults
Article information
Abstract
Background
Individuals with frailty are susceptible to adverse events. Although a psychological correlation with frailty has been observed, few studies have investigated the relationship between stress and frailty. This study examined the association between perceived stress and frailty in older adults.
Methods
This cross-sectional observational study included participants recruited between September 2021 and January 2022. The Korean version of the Perceived Stress Scale-10 was used to measure stress levels, while the frailty status was assessed using the Korean Frailty Index. Loneliness, depression, and satisfaction were measured using the UCLA Loneliness Scale, Centre for Epidemiological Studies Depression Scale, and Satisfaction with Life Scale, respectively. We used multinomial logistic regression to compare the variables between frail and robust participants.
Results
Among 862 study participants (mean age, 73.62 years; 65.5% women), the mean PSS-10 score was 15.26, 10.8% were frail, 22.4% were pre-frail, and 66.8% were robust. Perceived stress was significantly associated with pre-frailty (crude odds ratio [OR]=1.147; 95% confidence interval [CI], 1.093–1.204) and frailty (crude OR=1.417; 95% CI, 1.322–1.520). After adjusting for sociodemographic factors, we examined the associations between perceived stress and prefrailty (adjusted OR=1.140; 95% CI, 1.084–1.199) and frailty (adjusted OR=1.409; 95% CI, 1.308–1.518). After adjusting for all variables, including loneliness, depression, and satisfaction, perceived stress was significantly associated with frailty (adjusted OR=1.172; 95% CI, 1.071–1.283), however, insufficient statistical evidence was observed for pre-frailty (adjusted OR=1.022; 95% CI, 0.961–1.086).
Conclusion
Higher levels of perceived stress were associated with frailty in older adults. Stress management efforts may help improve frailty in this population.
INTRODUCTION
Frailty is a clinical syndrome that is associated with aging. It is characterized by the deterioration of multiple physiological functions with marked vulnerability to endogenous and exogenous stresses. Frail individuals are susceptible to adverse health outcomes, including disability, prolonged hospital stay, and mortality.1-3) Although no definitive criteria exist for evaluating frailty, previous studies have verified multiple factors. Physical assessments include conventional approaches, such as grip strength, walking speed, and weight loss.4) Additionally, a psychological correlation with frailty was recently reported. Adverse psychological outcomes, such as depression or anxiety, could worsen frailty status in older adults.5) In addition, many interventions to improve psychological outcomes have been attempted, with limited effectiveness.6,7)
As frail individuals are susceptible to adverse stress events, measuring perceived stress may help predict their frailty status. Perceived stress is the subjective concept of feelings or thoughts about one’s ability to cope with problems or difficulties. Despite similar negative life events, perceived stress can differ depending on factors such as coping resources and personality.8) Perceived stress is commonly measured using the Perceived Stress Scale,9) which is one of the most verified measurements and has been translated into various languages, including Korean.
Most previous studies focused on the symptoms of depression or anxiety. Few studies have examined the association between stress and frailty, especially in Korea. Since South Korea is transitioning into a super-aged society with concurrent stress-laden systems, adapting to these circumstances has become demanding. Therefore, this study examined the association between perceived stress and frailty among older adults in South Korea.
MATERIALS AND METHODS
This cross-sectional, observational study recruited participants between September 2021 and January 2022. A total of 1,064 participants were enrolled from 30 senior community centers in South Korea. Each participant completed a questionnaire supervised by well-trained interviewers to collect demographic data (age, sex, highest educational level, marital status, working status, place of residence, and cohabitation status). Education level was categorized as lower than middle school and higher than high school graduation; residences as urban, suburban, and rural areas; cohabitation status as either alone or not alone, which indicated living with someone else; marital status as married or unmarried and included single, divorced, separated, and bereaved; working status as working or nonworking. The interviewers received a manual for each questionnaire and underwent training sessions before survey initiation.
We also measured perceived stress, frailty, loneliness, depression, and life satisfaction. We utilized the Korean version of the Perceived Stress Scale-10 (PSS-10),10) which comprises 10 questions, with a total score of 40. The scores for four questions are reversed, with a higher score corresponding to a greater perception of stress. We assessed frailty status using the Korean Frailty Index (KFI),11) a multidomain phenotype consisting of seven self-reported questions and one physical measurement. The participants were classified as robust (KFI score of 0–1), pre-frail (KFI score of 2–3), or frail (KFI score of ≥4). Participants with missing data were selectively included if the frailty status could be determined based on the answered questions, regardless of the score of the unanswered questions. We evaluated social isolation using the Korean version of the revised UCLA Loneliness Scale (ULS).12) The ULS consists of 20 questions, each with 1–4 possible points. The scores of nine questions are reversed, with a higher score indicating a feeling of being more socially disconnected. We assessed depression using the Korean version of the Center for Epidemiological Studies Depression Scale (CES-D).13,14) The CES-D consists of 11 items, each scoring 0–3 points. The scores for the two items are reversed. A cutoff score of 9 points was used to identify individuals at risk of depression. We obtained the cognitive evaluations of personal life satisfaction using the Satisfaction with Life Scale (SWLS).15,16) The SWLS consists of five items, each scored from 1–5 points. Higher scores on the assessment are associated with higher levels of life satisfaction.
After data collection, we examined the sociodemographic characteristics and measurements. Baseline variables were summarized according to the robust, pre-frail, and frail groups using the chi-square test for categorical variables and analysis of variance (ANOVA) for continuous variables. We applied multinomial logistic regression to compare the variables of frail or pre-frail participants with those of robust participants. First, we used univariate logistic analysis to calculate the crude odds ratio (OR) for the association between frailty status and perceived stress. Next, we constructed adjusted models by sequentially adding significant variables and obtaining adjusted ORs. We calculated the ORs and 95% confidence intervals (CIs) for the pre-frailty and frailty groups. IBM SPSS Statistics for Windows, version 29.0 (IBM, Armonk, NY, USA) was used for the statistical analyses. Statistical significance was set at p<0.05. This study was approved by the Institutional Review Board of Kyung Hee University (No. KHGIRB-21-389); and complied with the tenets of the Declaration of Helsinki and the ethical guidelines for authorship and publishing in the Annals of Geriatric Medicine and Research.17) Written informed consent was obtained from each participant before or at registration.
RESULTS
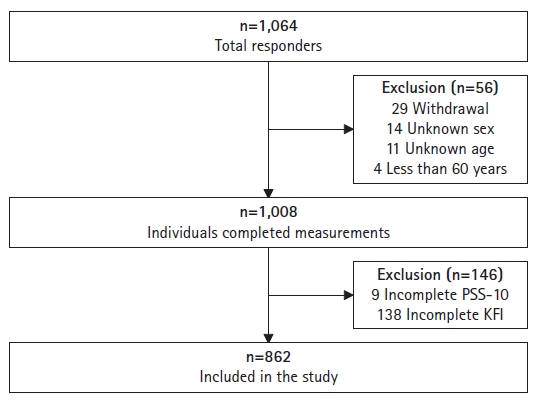
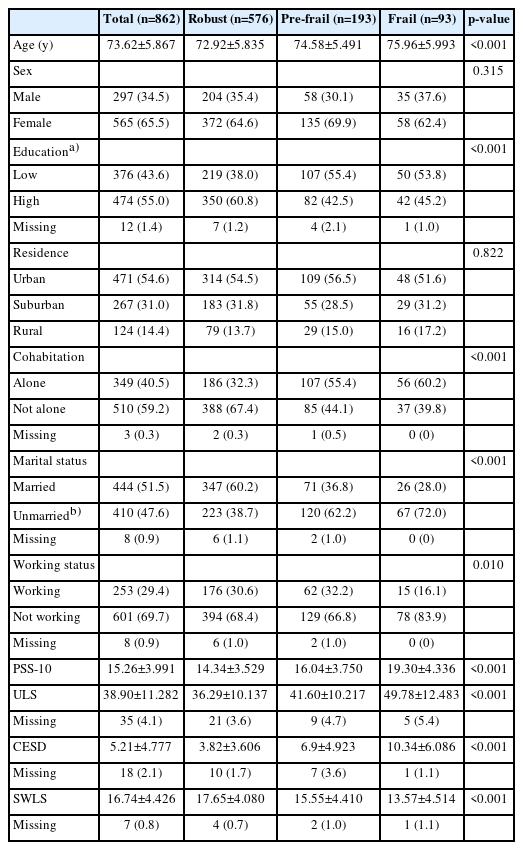
A total of 1,064 participants were recruited, of which 56 were excluded because of dropouts or missing age and sex data. The subsequent exclusion of 146 participants because of incomplete PSS-10 or KFI resulted in the inclusion of 862 participants in the final analysis (Fig. 1). The mean age of these participants was 73.62±5.867 years and 65.5% (n=565) were women. The mean PSS-10 score was 15.26±3.991. Among the participants, 10.8% (n=93) were frail, 22.4% (n=193) were pre-frail, and 66.8% (n=576) were robust. Additional descriptive data are presented in Table 1.
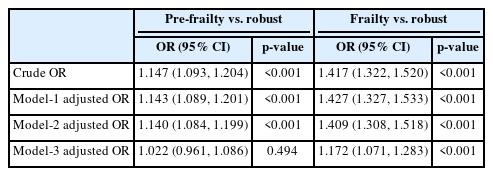
Perceived stress was significantly associated with pre-frailty (crude OR=1.147; 95% CI, 1.093–1.204) and frailty (crude OR=1.417; 95% CI, 1.322–1.520). After adjusting for sex, age, education, residence, cohabitation, marital status, and working status, the associations between perceived stress and pre-frailty (adjusted OR=1.140; 95% CI, 1.084–1.199) and frailty (adjusted OR=1.409; 95% CI, 1.308–1.518) were statistically significant. Furthermore, after adjusting for all variables, including loneliness, depression, and satisfaction, perceived stress was significantly associated with frailty (adjusted OR=1.172; 95% CI, 1.071–1.283). However, insufficient statistical evidence was observed between perceived stress and pre-frailty (adjusted OR=1.022; 95% CI, 0.961–1.086) (Table 2).
DISCUSSION
Our findings demonstrated that perceived stress was associated with frailty. Frail individuals were more likely to experience higher levels of perceived stress than individuals with pre-frailty. Frailty and pre-frailty were significantly associated with age, low educational level, living alone, being unmarried, currently working, loneliness, depression, and low life satisfaction. Although sex and residence were not significantly associated with frailty, we also considered these variables in our analysis because of their clinical significance. After adjusting for confounders, perceived stress remained associated with frailty.
Depression, anxiety, loneliness, and low life satisfaction are significantly related to frailty.5,18-21) Furthermore, individuals with frailty have higher levels of perceived stress and stress-related symptoms, although the exact mechanism remains uncertain.22)
Theoretically, frail older adults are more likely to deteriorate after experiencing stressful events because of decreased resilience and homeostatic reserve.23) Unlike robust individuals, those with frailty have a lower capacity to adapt; therefore, they do not return to homeostasis and manifest functional dependency. The homeostatic function of the endocrine system such as the hypothalamic-pituitary axis is reduced during aging.24) Thus, the pattern of cortisol secretion, an essential biomarker of stress, may be altered. Specifically, lower morning and higher evening salivary cortisol levels are associated with frailty.25,26) The empirical observation of dysregulation may provide a plausible biological background for a decreased capacity to cope with stress.
The reported associations of psychological problems with frailty suggest the need for the proper management of difficulties to improve patient resilience.27) The results of the present study suggest that perceived stress is an important management target. Further clinical studies are required to identify effective treatment methods.
Regarding limitations of this study, the first was measurement errors resulting from self-reported assessment methods. Second was a possible selection bias owing to the exclusion of participants with missing data or those who dropped out during the study. Third, the causal relationship between frailty and perceived stress was nuanced. Frailty itself increased perceived stress, or a bidirectional interplay might exist. Longitudinal studies are required to assess the potential long-term outcomes and causal relationships. Fourth, data regarding chronic diseases and other medical indicators were not collected. Fifth, the generalizability of the findings to broader populations was limited. Therefore, follow-up studies using data from other communities with varying psychological outcomes are warranted.
In conclusion, higher levels of perceived stress were associated with frailty in older adults. Stress management efforts may help improve frailty in this population.
Notes
CONFLICT OF INTEREST
The researchers claim no conflicts of interest.
FUNDING
None.
AUTHOR CONTRIBUTIONS
Conceptualization, SHL, JS, JKC; Data curation, SU, HRS, YSK; Investigation, SU, HRS, YSK; Methodology, SHL, JKC; Supervision, JKC; Writing-original draft, SHL, JKC; Writing-review & editing, SHL, JS, JKC.


