Associations of Death at Home with Medical Resources and Medical Activities in Cancer Patients: A Nationwide Study Using Japanese National Database
Article information

Abstract
Background
Over half of the Japanese population hope to spend their last days at home; however, 73.0% die in hospitals. The proportion of deaths due to cancer in hospitals is even higher, at 82.4%, and is also high globally. Therefore, there is an urgent need to establish conditions that fulfill the hopes of patients, especially those with cancer, who hope to spend their last days at home. This study aimed to clarify medical resources and activities that are related to proportion of death at home among cancer patients.
Methods
We used data from the Japanese National Database and public data. Japan's Ministry of Health, Labour, and Welfare provides national data on medical services to applicants for research purposes. Using the data, we calculated the proportion of deaths at home in each prefecture. We also collected information on medical resources and activities from public data and conducted multiple regression analyses to investigate factors associated with the proportion of death at home.
Results
In total, 51,874 eligible patients were identified. The maximum and minimum proportions of death at home based on prefectures differed by approximately three-fold (14.8%–41.6%). We also identified scheduled home-visit medical care (coefficient=0.580) and acute and long-term care beds (coefficient=-0.317 and -0.245) as factors that increased and decreased the proportion of death at home, respectively.
Conclusion
To fulfill the hopes of cancer patients to spend their last days at home, we recommend that the government develop policies to increase home visits by physicians and optimize hospital acute and long-term care beds.
INTRODUCTION
Japan is currently the most aged country worldwide.1) The population aged 65 years and older is approximately 36.4 million, and the percentage of older people has reached 29.1%.2) This shows that aging is progressing at an unprecedented speed worldwide. In addition, Japan's total population is declining, with births falling below 900,000 and deaths exceeding 1.3 million.3) The estimated death toll in 2030 is 1.6 million.4,5) Therefore, Japan is a super-aging and multi-death society.
According to a survey by the Cabinet Office of Japan, over half of the population (approximately 55.0%) hope to spend their last days at home. However, only approximately 10% die at home, and 73% die in a hospital.6) In particular, the proportion of hospital deaths due to cancer, which is the leading cause of death, is even higher at 82.4% and is also high globally.7,8) These findings suggest possible discrepancies between the people's hope and their actual places of death. A high percentage of people dying at home and low percentage of people being admitted to and dying in hospitals are considered indicators of appropriate care at the end of life.9) Therefore, there is an urgent need to establish conditions for fulfilling the hopes of patients to die at home, especially cancer patients.
Previous studies demonstrated that a high level of physician home visit activity is associated with patient deaths at home.10) Another contributing factor is the provision of home visits to end-stage cancer patients and bedridden patients without cancer at home-care support clinics.11) A previous survey on visiting nurse agencies revealed additional contributing factors to the patient home death rate, including the patient's lack of attachment to the hospital, a contractual relationship with a home-care support clinic, and two-way information exchange by telephone or face-to-face communication with the attending physician.12) These findings on medical activity provide valuable insights into death at home in Japan. However, these studies were often limited to small regions or groups, and large-scale studies investigating factors that influence the proportion of deaths at home are lacking. An association between death at home and the density of home-care resources has also been reported by a study using public data from Japan.13) However, because the report included suicides and homicides as deaths at home, the accuracy of the proportion of deaths at home calculated in the study remains an issue.
Therefore, it is essential to fulfil the people’s hopes by identifying differences between areas with high and low death at home rates and defining significant characteristics such as medical resources and activities related to death at home through large-scale and highly accurate survey data. In other words, understanding the actual conditions and factors associated with death at home in detail is crucial. Clarifying the factors associated with death at home in Japan, which is an aging country, is also expected to inform other countries that are also aging. Therefore, this study aimed to clarify the actual proportions and factors associated with death at home in cancer patients by analyzing the Japanese National Database (NDB).
MATERIALS AND METHODS
Data Source
We analyzed three datasets in this study, including the NDB; public data from the Ministry of Health, Labor, and Welfare; and the standardized claim data ratio (SCR) published by the Cabinet Office. Japan's Ministry of Health, Labour and Welfare provides applicants with the NDB, which is a big data related to medical services for research purposes.14) The NDB is a highly universal database that contains health insurance claim and specific health checkup data from all over Japan and stores >90% of the total information.15) Several studies with useful results using the NDB have been reported.16,17) The present study used the NDB to collect large-scale and accurate data on deaths at home among cancer patients. The NDB extraction period was from April 2017 to March 2018. The Ministry of Health, Labour, and Welfare extracted the NDB data using the following extraction flow and provided it to the authors in an aggregated format. First, the data on cancer patients were extracted based on their disease names. This extraction excluded “cases with suspicion” and “cases with the curative outcome.” Next, “patients with registered deaths in the outcome” or “patients with medical fees received by physicians when the patient died at home” were extracted. The patients were then restricted to those aged 65 years and older according to the definition of geriatric population applied in this study. Finally, the extracted patients were classified as “hospitalized patients,” “outpatients with medical fees for home death,” and “other outpatients.” The data were provided in a format that could be aggregated by prefecture. We calculated the proportion of deaths at home as the ratio of outpatients with medical fees for deaths at home to the total number of deaths. To determine the proportion of deaths at home and extract the data on outpatients whose outcome were death, we devised ways to improve the accuracy by extracting cases for which medical fees related to death at home were calculated. By examining cases in which physicians were involved in patients who died at home, the proportion of patients who died at home was calculated.
We collected public data and SCR to examine medical resources and activities. The public data included resident information, medical resources, and medical activities provided online by the Ministry of Health, Labour, and Welfare and the Cabinet Office of Japan. We collected these data to investigate factors associated with the proportion of death at home.
The resident information included the number of people per household,18) percentage of households with older adult couples,19) percentage of older adults in single-person households,20) and national medical expenses per person.21)
The medical resources included the number of home-care support clinics,22) home-care support hospitals,23) visiting nursing stations,24) acute care beds, and long-term care beds.25,26) These data were collected in numbers per 100,000 people in the prefectures.27)
The medical activities included the frequency of medical fee data for acute care hospitalization, chronic care hospitalization, unscheduled home-visit medical care, scheduled home-visit medical care, and home-visit nursing care. These were extracted from the SCR published by the Cabinet Office of Japan.28) The SCR shows sex/age-adjusted regional differences in medical practice based on medical claims information. An SCR of 100 is consistent with the national average.29) In Japan, unscheduled and scheduled home-visit medical care are items billed when a physician provides medical care in the patient's home. Unscheduled and scheduled home-visit medical care did not include home nursing or rehabilitation.
We did not obtain ethical approval as we only used existing data that were aggregated by the prefecture.
Database Construction
All data collected in this study were aggregated by prefecture, and a database was constructed. Since there are 47 prefectures in Japan, the analysis included 47 subjects.
Statistical Analysis
Three types of analyses were performed. First, we calculated and graphed the statistics of the proportions of death at home by prefecture. Second, we classified the 47 prefectures into two groups according to the median proportion of deaths at home (high and low) and compared the associated factors according to these groups. Third, we performed a multiple regression analysis using the forward-backward stepwise selection method to estimate the factors affecting the proportions of deaths at home. This analysis was performed after confirming the normal distributions of the objective variables.
We report the means and standard deviations and compared the groups using the Welch's t-test. To accommodate multicollinearity, we performed a multiple regression analysis, excluding duplicate variables if the correlation between the explanatory variables was >0.7. All p-values were two-tailed, and statistical significance was set at p<0.05. All statistical analyses were conducted using IBM SPSS Statistics for Windows, version 28.0 (IBM Corp., Armonk, NY, USA).
RESULTS
Patients
During the 12-month study period, we extracted data from 181,453 patients aged 65 years and older. Additionally, we identified 51,874 patients who died at home (outpatient with medical fees for home deaths) (Fig. 1). The patients included were 28,557 males and 23,317 females.
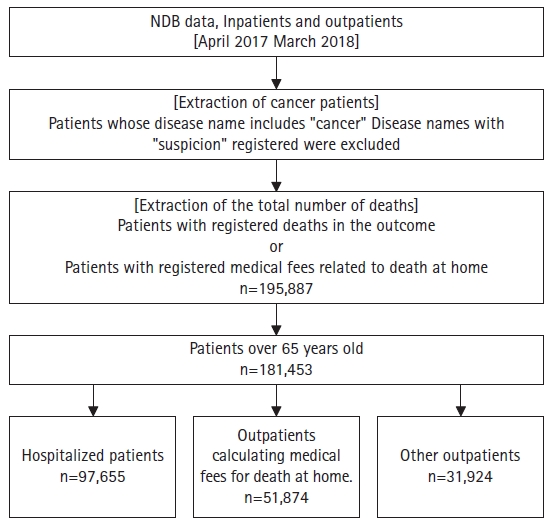
Patient selection. This study calculated the proportion of deaths at home as the proportion of those with outpatients' medical fees for deaths at home to the total number of deaths. NDB, National Database.
The Proportion of Deaths at Home by Prefecture
Fig. 2 shows the proportions of deaths at home by prefecture. The mean proportion of deaths at home across all prefectures was 26.1%±6.0%, ranging from 14.8% (Akita) to 41.6% (Kanagawa). A three-fold difference was observed between the minimum and maximum values.
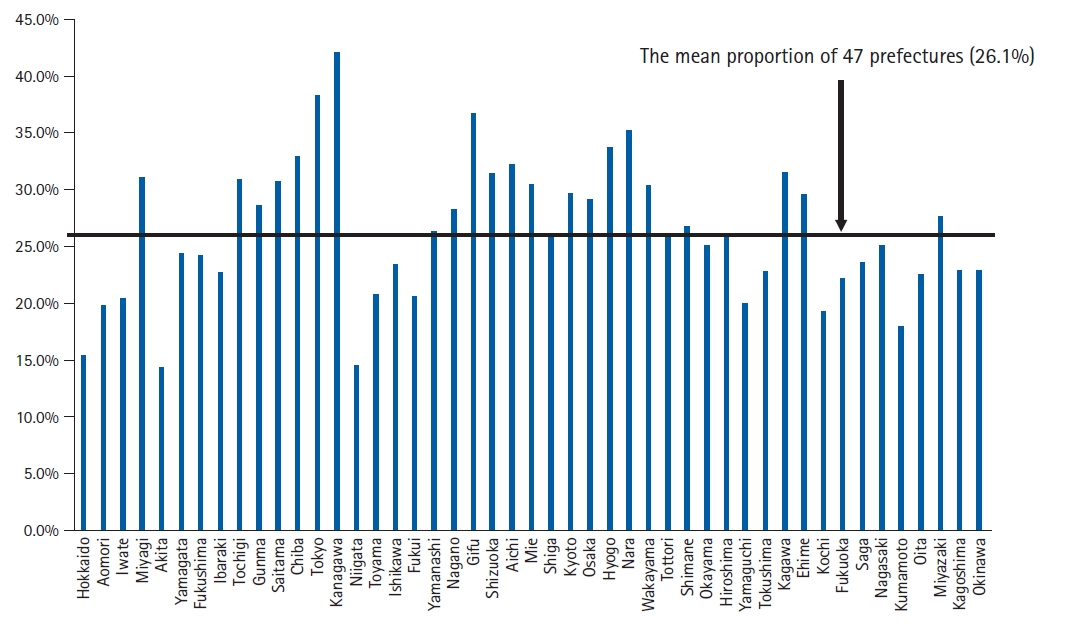
The proportion of deaths at home by prefecture. The bar graph shows the proportion of deaths at home in 47 prefectures in Japan. The horizontal line in the graph shows the mean proportion of deaths at home in 47 prefectures.
Comparison of the Proportions of Deaths at Home according to High and Low Groups
Table 1 compares the factors associated with high and low proportions of death at home. Among the 47 prefectures, 24 and 23 were assigned to the high and low proportions of death at home groups, respectively. Nine items differed significantly between the two groups. The high group demonstrated significantly higher SCR for unscheduled and scheduled home-visit medical care and home-visit nursing care than the low group. Conversely, the low group showed significantly higher national medical expenses per person, number of home-care support hospitals and acute and long-term care beds, and SCR for acute and chronic care hospitalization than the high group.

Comparison of the factors associated with high and low groups of death at home
Factors Associated with the Proportions of Deaths at Home
Table 2 presents the factors affecting the proportion of death at home. Due to multicollinearity, we excluded national medical expenses per person and SCR for chronic care hospitalization and unscheduled home visits from the explanatory variables. The multiple regression analysis identified three items that significantly affected the proportion of death at home. Among the items, the SCR for scheduled home-visit medical care (β = 0.580) was a factor that was related to increased proportions of death at home, whereas the number of acute (β=-0.317) and long-term care beds (β=-0.245) were associated with reduced proportions of death at home. The adjusted R2 value for the multiple regression model was 0.627.

Associated factors for the proportion of deaths at home by multiple regression analysis
DISCUSSION
In this study, we used the Japanese NDB, public data, and SCR to clarify the medical resources and activities that affect the proportion of death at home for cancer patients.
This study had two advantages. The first was clarifying the actual proportion of death at home using large-scale nationwide data. In particular, the widespread use of the NDB is expected to elucidate the current state of home medical care in Japan.5) Second, we extracted the data on patients who died at home with high accuracy by calculating medical fees related to deaths at home, including cases visited by physicians and confirmed deaths at home. We believe that these advantages allowed us to clarify the actual proportion of deaths at home in Japan.
The analysis revealed specific differences by prefecture in the proportions of deaths at home of cancer patients; we found an approximately three-fold difference between the maximum and minimum values. Moreover, we found that physicians’ activities in home-visit medical care substantially increased the proportion of deaths at home. By contrast, the number of acute and long-term care beds significantly decreased the proportion of deaths at home.
To our knowledge, this is the first study to use large-scale and highly accurate data. As the findings were obtained by verifying the NDB, public data, and SCR throughout Japan, our results indicated a universal tendency regarding death at home in Japan. In addition, these findings could provide valuable suggestions for the challenges regarding death at home in other countries with aging populations, as in Japan.
The proportion of deaths at home was the highest (41.6%) in Kanagawa. Kanagawa had the highest SCR for home-visit medical care in Japan (153.7), supporting the results of multiple regression analysis. Moreover, the prefecture’s number of acute beds corrected by population was the second lowest in Japan (362.3 beds per 100,000 population). Hence, we determined that the proportion of deaths at home was high in Kanagawa owing to the increased home-visit medical care and lack of hospital beds in the acute phase. In contrast, the proportion of deaths at home in Akita was the lowest (14.8%). In Akita, the SCR for home-visit medical care and nursing were the second lowest in Japan (SCR=43.9 and 47.6, respectively). Contrarily, the number of acute beds corrected by population in the prefecture was the fifth highest in Japan (594.0 beds per 100,000 population). Thus, we determined that the proportion of deaths at home in Akita was low because of a lack of home-visit medical and nursing care combined with access to acute care hospital beds. The average age of the population by prefecture was higher in Akita than in Kanagawa (53.2 vs. 46.8 years).30) This difference indicates different levels of care in these areas, which could affect whether the patients can receive home medical care. In an aging area such as Akita, inpatient care may be preferred because of the burden of care; thus, the proportion of deaths at home might be lower. In addition, the number of long-term care beds reduced the proportion of deaths at home. The SCR for chronic care hospitalization was significantly lower in the group with a high proportion of deaths at home. Therefore, more long-term care beds and improved long-term care also led to a low proportion of deaths at home.
These results demonstrated the need to improve home-visit medical care activities to increase the proportion of cancer patients who die at home. Therefore, physicians should be trained to provide home-visit medical care, and home-visit medical fees must be increased. Chiba et al. reported that compared to cases in hospitals, home-visiting physicians more frequently explained the meaning of death at home and its process, available insurance systems, and financial information.31) Therefore, it is particularly important to train home-visiting physicians to explain this information. Enhancing home-visit medical care activities may improve home-based palliative care and establish a system that enables cancer patients to fulfil their hope of spending their last days at home. Simultaneously, the optimization of medical resources allocation in acute and long-term care beds, which affects the proportion of deaths at home, is another issue to be resolved.
Although the present study had significant findings, it also had some limitations. First, regarding death at home, it is important that the patient has hope for spending their last days at home and have family members who could care for the patient. However, this information could not be obtained from the NDB or public records. Additional large-scale qualitative studies are required to verify these findings. Second, it was impossible to clarify the death status of other outpatients. The deaths of other outpatients included lonely deaths without family members, sudden deaths due to sudden illness, and deaths at home, which did not meet our study criteria. On the other hand, other outpatients might have died at home but did not meet the requirements of this study. Therefore, we might have underestimated the proportion of deaths at home in this study. Third, since we analyzed data that had already been aggregated, we could not ascertain underlying diseases other than cancer. The target patients might have included those who died of diseases other than cancer. Since older individuals tend to have many comorbidities, the results of this study should be carefully interpreted.
In conclusion, using the Japanese NDB, public data, and SCR, we clarified the medical resources and activities that affect proportion of death at home for cancer patients. Physicians’ home-visit medical care activities significantly increased the proportion of deaths at home. Conversely, the number of acute and long-term care beds significantly decreased the proportion of deaths at home. In Japan, which faces a super-aging and multi-death society, the government should consider optimizing medical resources and activities to enable cancer patients to fulfil their hopes of spending their last days at home.
Notes
We thank Dr. Jimpei Misawa and Dr. Yukinori Moriya for providing helpful advice for this study.
CONFLICT OF INTEREST
The researchers claim no conflicts of interest.
FUNDING
This work was supported by the Japan Society for the Promotion of Science Grant-in-Aid for Scientific Research (C) (Grant No. JP19K10550). The funders had no role in the study design, data collection, analysis, the decision to publish, or the preparation of the manuscript.
AUTHOR CONTRIBUTIONS
Conceptualization, KT, KF, TO, HC; Data curation, KT, KF; Funding acquisition, KT; Investigation, KT; Methodology, KT; Project administration, KT; Supervision, KF; Writing-original draft, KT; Writing-review & editing, KT, KF, TO, HC.