Associations between Work-Related Factors and Happiness among Working Older Adults: A Cross-Sectional Study
Article information

Abstract
Background
As the global population ages, the number of older adults working after retirement is increasing. However, knowledge regarding working conditions for health and happiness among this population is insufficient. Therefore, we examined the association between work-related factors (e.g., employment status, daily working time, work-related stress) and happiness among working older adults.
Methods
This cross-sectional study recruited Japanese older adults, aged 65 years and older, who were engaged in paid work, during their annual health checkups. Self-administered questionnaires were used to assess happiness, employment status, daily working time, and work-related stress (i.e., job strain, job control, job suitability, and relationships at work).
Results
The data of 520 men and 168 women were analyzed (mean ages, 68.5 years and 68.0 years, respectively). The results of the multivariable ordinal logistic regression analysis indicated that low job suitability was negatively associated with happiness in men (odds ratio [OR]=0.46; 95% confidence interval [CI], 0.28–0.78; p=0.004). In women, long working hours and low job control were negatively associated with happiness—working >8 hours daily (OR=0.29; 95% CI, 0.12–0.71; p=0.008) and low job control (OR=0.29; 95% CI, 0.12–0.72; p=0.009).
Conclusion
The results showed that low job suitability for men and long daily working time and low job control for women were negatively associated with happiness. These findings suggest the need to improve working conditions to enhance the well-being of working older adults.
INTRODUCTION
With the continuously aging global population, achieving both health and longevity among older adults is an important public health challenge. In particular, maintaining social engagement during old age is crucial for ensuring healthy aging and enhancing peoples’ well-being.1,2) Continuing to engage in paid work is a particularly promising social commitment for this population group. In addition to the income earned, engaging in paid work provides multiple benefits for older adults, including greater social contributions, larger social networks, and more meaningful life goals, which lead to positive health benefits and overall improved well-being.3)
Recently, particularly in Japan, where the aging rate is the highest worldwide, an increasing number of older adults either continue or intend to return to work after retirement, despite Japan’s mandatory retirement age of 65 years.4,5) In terms of working or not working post-retirement, a growing body of evidence has demonstrated the effects on the physical and mental health of older adults. From a traditional perspective, retirement due to old age does not necessarily have a negative effect. Some systematic reviews have suggested the positive impact of retirement on mental health.6,7) Meanwhile, other studies have reported the positive health impacts of working post-retirement.8) Thus, the results have been inconsistent.
Despite the contradictory results of these previous studies, the social environment of older adults is changing, such as an increasing number of individuals living alone and the weakening of their neighborhood relationships.9,10) Thus, the meaning of post-retirement work may have changed. Therefore, further research is needed. In this context, the latest systematic review suggested the overall positive effects of people working in older age on physical and mental health.11) Additionally, recent studies of a large sample of older Japanese adults reported that continuing to work during old age was associated with a lower risk of mortality,12) greater activities in daily living,13) higher functional capacity,14) healthy cognitive functioning,12) and better mental health maintenance.12) Furthermore, working during older age also helped to prevent the incidence of long-term care.15) Therefore, as the latest evidence suggests, continuing to work during older age may be a promising approach to increasing the social engagement of this population group, which could, in turn, maintain their overall health and well-being.
Despite the increasing number of older adults continuing to work post-retirement, limited research has focused on the personal impact of their job conditions, such as employment status or working environment. A previous systematic review suggested that working post-retirement had overall positive health effects, while poor working environments and high work-related stress had negative impacts,11) including on physical and mental health.16,17) Additionally, adverse health effects may occur depending on older adults’ motivation to work.18) These studies highlight the need for further research on positive work-related factors to support employed older adults’ overall well-being. However, evidence is insufficient regarding these work-related factors that affect the health and well-being of working older adults. Further studies on this association are needed to promote healthy aging and maintain the well-being of older adults.
Therefore, this study examined the associations between work-related factors and happiness, a core concept of well-being, among working older adults.
MATERIALS AND METHODS
Study Participants
This cross-sectional study was conducted as part of the Japan Multi-Institutional Collaborative Cohort Study (J-MICC Study) in the Okazaki area.19,20) We recruited community-dwelling Japanese adults aged 35–79 years from among the participants of regular health checkups at a public health center in Okazaki City, Aichi, Japan, between 2007 and 2011. During this period, a self-administered questionnaire was mailed to the participants before their health checkups. Subsequently, the questionnaire was collected at the health check-up site. A total of 7,580 individuals were recruited (response rate, 25.9%).20) Responses from those <65 years of age (n=5,071), those not working (n=1,820), and those with missing information on the work status question (n=1) were excluded. Therefore, the final analysis included 688 older adults.
All participants provided written informed consent and the study protocol was approved by the ethics committee of affiliated institutions. This study was conducted in accordance with the latest guidelines of the Declaration of Helsinki.
Also, this study complied with the ethical guidelines for authorship and publishing in the Annals of Geriatric Medicine and Research.21)
Happiness
Based on a previous study, the participants’ levels of happiness were assessed using the following single question concerning subjective happiness: “How would you score your current sense of happiness on a scale out of 100 points?”22) Earlier research has suggested that happiness is an essential component of well-being23); therefore, we used this score as the outcome variable. We divided the score into four quartile ranges according to sex, as the data were not normally distributed—for men, 81.5±12.9 (mean±standard deviation), 80.0 (10.0) [median (interquartile range)], -1.38 (skewness), and 4.79 (kurtosis); for women, 82.6±13.5 (mean±standard deviation), 85.0 (10.0) [median (interquartile range)], -1.01 (skewness), and 4.28 (kurtosis).
Work-Related Factors
Regarding work-related factors, the participants’ employment status, daily working hours, and work-related stress were assessed using a self-administered questionnaire. Employment status was categorized as “self-employed,” “regular employment,” and “non-regular employment.” Daily working time was classified into three categories; “<6 hours,” “6–8 hours,” and “>8 hours.” Work-related stress was assessed using the simplified Brief Job Stress Questionnaire (BJSQ), which is a shortened version of the BJSQ with confirmed validity and reliability in assessing job stress.24,25) Using these variables, we evaluated four areas of work-related stress: job strain, job control, job suitability, and relationships at work.24) Job strain was defined as the psychological and physical workload. Job control was conceptualized as skill discretion and decision authority. Job suitability referred to the use of one’s own skills and knowledge at work, as well as job satisfaction. Relationships at work involved positive psychological relationships with colleagues. The participants answered 17 questions on work-related stress. Based on their responses, we assessed each type of stress and divided it into two categories (Supplementary Table S1).
Covariates
Based on a previous study,17) we included participants’ socioeconomic status, health status, and health-related behaviors as factors associated with job conditions and happiness. These included participants’ age, living arrangements, educational attainment, present illnesses, body mass index (BMI), alcohol consumption status, smoking status, and exercise habits. Living arrangements were dichotomized as “living alone” and “living with others.” Educational attainment was categorized as <9, 10–12, and ≥13 years. Present illnesses were categorized as “none” and “≥1” according to the number of diagnosed illnesses, including cancer, heart disease, stroke, hypertension, dyslipidemia, and diabetes. The BMI was dichotomized as <25.0 kg/m2 and ≥25.0 kg/m2. Alcohol consumption and smoking status were dichotomized as “never/past” and “current.” Exercise habits were dichotomized as <once/week and ≥once/week.
Statistical Analysis
All analyses were conducted according to participants’ sex, as men and women may have different priorities at work, particularly in the Japanese society, with different experiences and social meanings. First, we calculated the descriptive statistics collected from the participants’ demographic characteristics. Second, we used a multivariable ordinal logistic regression analysis to calculate the odds ratio (OR) and 95% confidence interval (CI) of the studied work-related factors as association variables with participants’ happiness scores in reference to the lowest quartile score category, based on the assumption of proportional odds.26) Two models were then used: a crude model with no adjustments and an adjusted model for all covariates.
As a sensitivity analysis, we ran similar analysis models on absolute happiness scores every 10 points.
To mitigate potential bias due to missing information, a multiple imputation method was applied under the missing at random (MAR) assumption (i.e., the missing data mechanism depends only on the observed variables). We generated 20 imputed datasets using the multiple imputations by chained equations (MICE) procedure and pooled the results using standard Rubin’s rule.27)
The significance level was set at p<0.05. R software version 3.6.3 for Windows (R Foundation for Statistical Computing, Vienna, Austria) was used for all statistical analyses. The multiple imputation approach involved the use of the MICE function (mice package).
RESULTS
The final analysis included data from 520 men and 168 women. Tables 1 and 2 show the characteristics of the male and female participants, respectively. The mean ages were 68.5±3.0 years for men and 68.0±2.6 years for women. Among the participating men, those with a higher level of happiness were more likely to have higher educational attainment, higher BMI, regular exercise habits, non-regular employment, high job strain, high job suitability, and good relationships at work; not consume alcohol or smoke; and work <5 hours daily. Among the participating women, those with a higher level of happiness were more likely to consume alcohol, have regular exercise habits, work for no more than 8 hours daily, have a high sense of job control, and feel a high sense of job suitability.
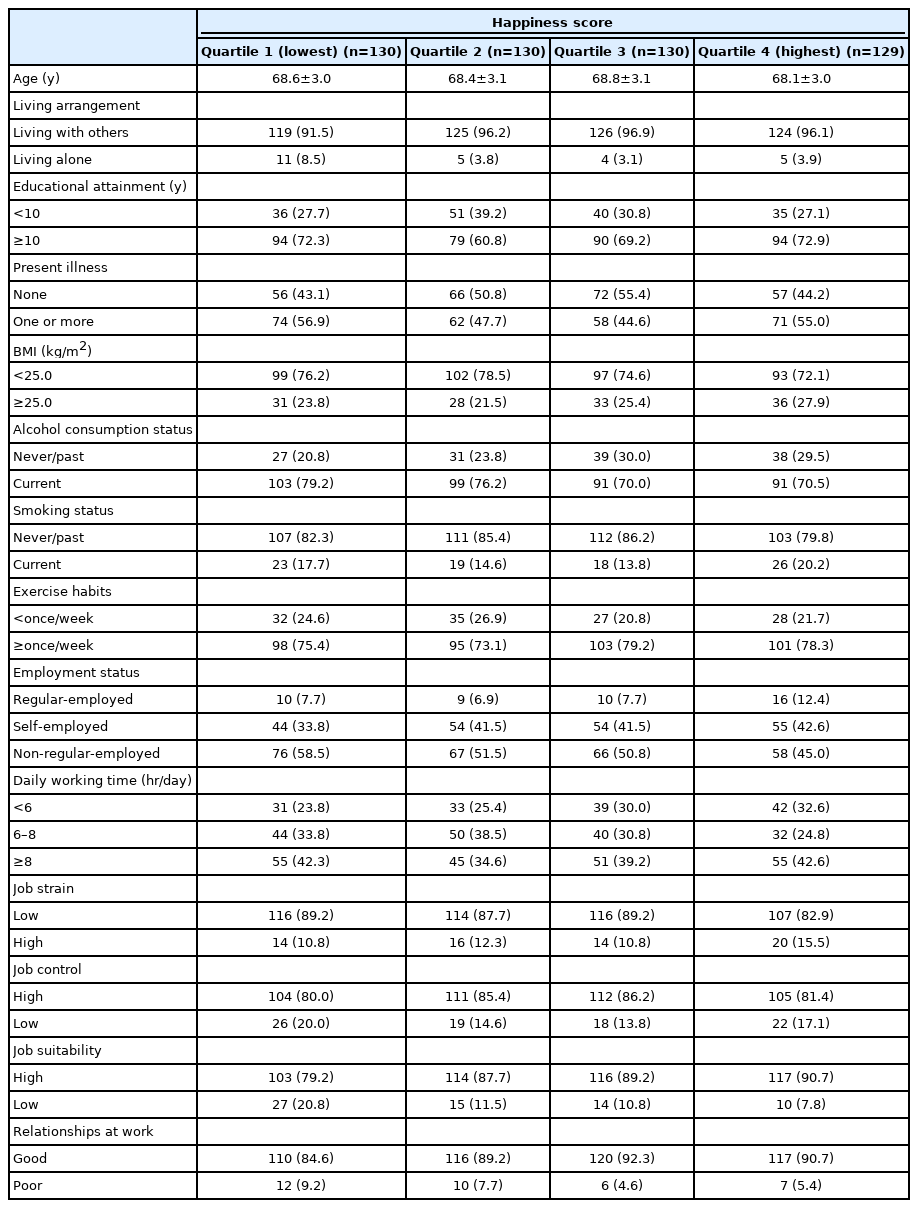
The characteristics of men participants

The characteristics of women participants
Table 3 shows the results of the analysis of associations between the examined work-related factors and participant happiness, as identified by multivariable ordinal logistic regression analysis conducted separately for men and women. After adjusting for covariates, low job suitability was negatively associated with happiness in men (OR=0.46; 95% CI, 0.28–0.78; p=0.004). In women, a daily working time of >8 hours and low job control were negatively associated with happiness (daily working time of <6 hours vs. >8 hours: OR=0.29; 95% CI, 0.12–0.71; p=0.008; low job control: OR=0.29; 95% CI, 0.12–0.72; p=0.009). These results showed similar trends in the sensitivity analysis, for which the outcomes were divided into absolute ranges (Supplementary Table S2).
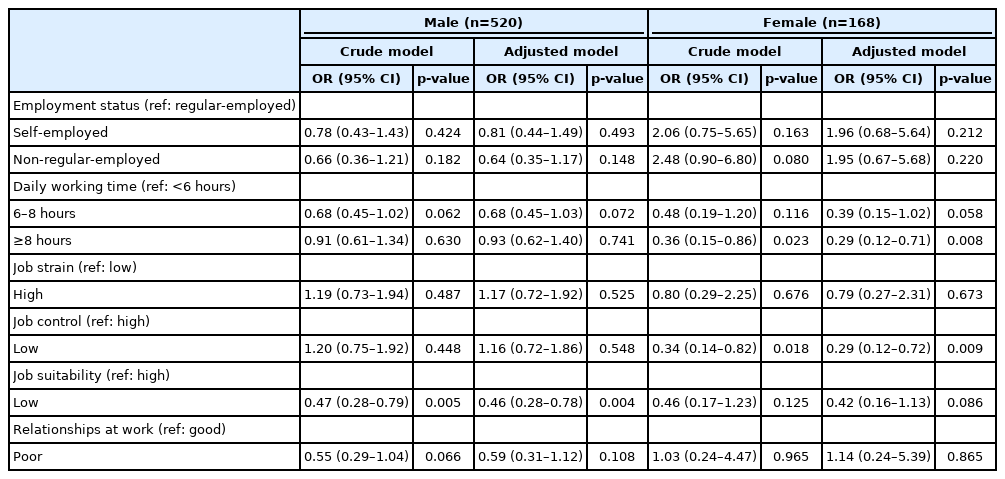
Associations between work-related factors and happiness among men and women, multivariable ordinal logistic regression analysis
The results of the analysis results after excluding self-employed participants were nearly the same as the main results (Supplementary Table S3).
DISCUSSION
This cross-sectional study examined the association between work-related factors and happiness in older adults. Our results indicated that low job suitability for men and long working hours and low job control for women were significantly and negatively associated with happiness. These findings underscore the conditions needed to promote beneficial working environments that enhance the well-being of working older adults.
Among older men, job suitability was associated with higher levels of happiness. The job suitability assessed in this study indicated that the use of work knowledge and skill sets in their work was associated with high levels of job satisfaction. In Japan, many older men regularly engage in single occupations until they reach the mandatory retirement age. Using their skills and knowledge in their older age during their retirement might increase their job satisfaction, potentially leading to higher life satisfaction. Additionally, men are more likely to seek a greater degree of professionalism and power in their workplace.28) Therefore, even in their retirement work, having the expertise to use their skills and knowledge might lead to happiness.
Meanwhile, among older women, job control was associated with higher happiness, while long working hours was negatively associated with happiness. The interpretation of these results is speculative; however, there are possible reasons for these findings. Many older adult women in Japan do not engage in full-time employment. Therefore, they may be more likely to search for decision-making authority in their work, such as discretion and freedom of choice in operation, when they continue to work at an older age. Alternatively, in Japan, women may engage in many tasks related to household and community matters. Therefore, non-discretionary working conditions and long working hours may interfere with domestic tasks, which might negatively affect women’s happiness.
A previous study reported the benefits of working in older age only for men, including preventing the onset of functional disability.13) Additionally, productive activities in older age, such as paid work and volunteering, were beneficial only for men’s mental health.29) These findings imply the presence of sex differences in the impact of working status among older adults. In Japanese society, the role of paid work likely differs between men and women because the latter are relatively more likely to also have a social role outside their employment, such as housework or various community social involvements.
Meanwhile, the sex differences in work-related factors of happiness might be influenced by employment status between men and women. Unlike men, self-employed cases were relatively low in women participants. However, our preliminary analysis that excluded self-employed respondents showed results that were highly similar to those of the main analysis. We presume that the work-related factors associated with happiness differ by sex and not by employment type. Therefore, when promoting increased employment for older adults, a given social system needs to carefully consider the quality of working conditions, in addition to the different job needs of men and women.
As the Japanese population ages, the number of older adults who continue to work after retirement will continue to increase.6,8) Our results provide information on how to structure working environments for employed older adults to enhance their overall health and happiness. However, despite the growing evidence that working in later years can benefit overall health and happiness, it might also have negative consequences.11,16,17) In addition to previous knowledge, our findings contribute to the promotion of the employment of older adults by identifying work-related factors that may be detrimental to happiness in this population group. The results of the present study highlight the need to consider the suitability of the job, create friendly working conditions, and make appropriate changes to the working environment when promoting increased employment of older adults. Further evidence is needed to promote the employment of older adults, including more detailed studies of working conditions and environments.
This study has certain limitations. First, the cross-sectional design prevented our determination of the causality of the investigated work-related factors on participants’ happiness. Therefore, further investigation using longitudinal data is required. Second, we had no information about participants’ economic status, such as income or overall wealth. These variables may have resulted in residual confounding factors. Third, we had no detailed information about the nature of the participants’ jobs (for instance, employment in blue- or white-collar jobs). This information is important to note because the relationship between work-related factors and happiness may differ depending on the nature of the job. Fourth, we had no information on existing or potential mental illnesses, including depression. Mental illness is an important determinant of happiness, which may result in a bias in our results. Fifth, this study recruited only those individuals who had received annual health check-ups at a public health center. In addition, the response rate of the participants to the study recruitment was low (25.9%). Therefore, the backgrounds of the study participants may differ from those of typical older workers in this area. Our sample might have been more health-conscious and had a higher socioeconomic status compared to those of the average worker. This limitation may have resulted in a selection bias. Finally, we recruited participants from only one public health center in a suburban area of Japan. The types and conditions of work may have characteristics unique to this area. Therefore, the generalizability of our results may be limited and future studies using a nationwide sample are required.
In conclusion, the results of the present study showed that low job suitability in men, as well as long daily working time and low job control in women, were significantly and negatively associated with happiness among older working adults. These findings underscore the need to improve the working conditions of this population group to enhance their overall health and well-being.
Notes
CONFLICT OF INTEREST
The researchers claim no conflicts of interest.
FUNDING
This work was supported by a research grant received from the Japan Small Business Welfare Foundation, Japan Full-Hap Survey Research Grant (2020). This study was also supported by the Japan Society for the Promotion of Science (JSPS) KAKENHI Grant (No. 21K17322), Research Founding for Longevity Sciences from the National Center for Geriatrics and Gerontology (No. 21-17), the Lotte Research Promotion Grant (2021), and a grant from the Tanuma Green House Foundation (2021). The J-MICC Study and the partial study conducted in the Okazaki area were supported by Grants-in-Aid for Scientific Research for Priority Areas of Cancer (No. 17015018) and Innovative Areas (No. 221S0001), by a Grant-in-Aid from JSPS KAKENHI Grants (No. 16H06277, 19590643, 23590806, 19K242777, 21K17322, and 22J01409). The funders had no role in the study design, data collection, data analysis, and interpretation, writing of the report, or in the decision to submit the article for publication.
AUTHOR CONTRIBUTIONS
Conceptualization, TNoguchi; Data curation, SS, TY; Formal analysis, TNoguchi; Supervision, SS; Writing_original draft, TNoguchi; Writing_review & editing, TNoguchi, SS, TNishiyama, TO, HNS, MW, AH, YT, TY.
SUPPLEMENTARY MATERIALS
Supplementary materials can be found via https://doi.org/10.4235/agmr.22.0048.
Questions about job-related stress
Associations between work-related factors and happiness divided into 10 categories among men and women, multivariable ordinal logistic regression analysis
Associations between work-related factors and happiness excluding the self-employed, multivariable ordinal logistic regression analysis