Possible Sarcopenia and Its Association with Nutritional Status, Dietary Intakes, Physical Activity and Health-Related Quality of Life among Older Stroke Survivors
Article information

Abstract
Background
Screening for sarcopenia in the stroke population is an emerging concept in research and clinical practice. Therefore, this cross-sectional study aimed to assess the prevalence of possible sarcopenia and its associated factors among older stroke survivors who visited the neurology and rehabilitation departments of three public hospitals in Malaysia.
Methods
We acquired data on sociodemographic characteristics, clinical profiles, malnutrition risk, dietary intake, physical activity level, and health-related quality of life. Possible sarcopenia was diagnosed in individuals with decreased calf circumference and low handgrip strength, as proposed by the Asia Working Group for Sarcopenia (2019). Finally, we performed descriptive analysis and binary logistic regression.
Results
Among 196 older adults with stroke (mean± standard deviation of age: 67.60 ± 5.70 years), 42.3% had possible sarcopenia, with a higher prevalence in the more advanced age group (≥70 years). In univariable analysis, possible sarcopenia was significantly associated with anthropometric indices, malnutrition risk, nutrient intake, physical activity level, and health-related quality of life. In multivariable analysis, body mass index (adjusted odds ratio [AOR]=0.57; 95% confidence interval [CI], 0.43–0.75) was the only factor associated with possible sarcopenia among individuals aged ≥70 years. Recurrent stroke (AOR=3.48; 95% CI, 1.02–11.92), body mass index (AOR=0.64; 95% CI, 0.54–0.76), and EQ-5D index (AOR=0.15; 95% CI, 0.03–0.78) were significantly associated with possible sarcopenia in the 60–69-year age group.
Conclusion
The prevalence of possible sarcopenia among community-dwelling older stroke survivors was high. Therefore, we recommend routine screening for possible sarcopenia to ensure early nutritional and exercise intervention.
INTRODUCTION
The aging process places older adults at higher risks of malnutrition and stroke. Approximately three-quarters of strokes occur in people aged >65 years.1) Strokes in older adult patients are generally more severe and have poorer prognosis and clinical outcomes than those in younger patients.2) The assessment for sarcopenia among the stroke population is a recently emerging concept in research and clinical practices. Sarcopenia is defined as “a progressive and generalized skeletal muscle disorder associated with increased likelihood of adverse outcomes including falls, fractures, physical disability and mortality”.3) Although sarcopenia is primarily related to the aging process, it may be accelerated in the presence of physical inactivity; malnutrition; and specific diseases such as stroke, endocrine diseases, and malignant tumors.4)
To date, only few studies have investigated the prevalence of sarcopenia in the stroke population. Studies in the United States and Japan reported a prevalence of sarcopenia after stroke ranging from 14% to 54%.5,6) Other studies reported a sarcopenia prevalence of up to 54% among older Japanese patients undergoing rehabilitation in ward.7,8) Sarcopenia was significantly associated with worse recovery activities of daily living, dysphagia, and a lower rate of home discharge.7,8) An individual is diagnosed with sarcopenia if he or she has low appendicular skeletal muscle mass (ASM) and muscle strength or low physical performance.9) However, ASM measurement requires expensive devices such as magnetic resonance imaging, computed tomography, dual-energy X-ray absorptiometry, and bioelectrical impedance analysis.9) Acknowledging the difficulties of installing advanced diagnostic equipment in the primary health care or community setting, the Asian Working Group for Sarcopenia (AWGS) in 2019 proposed the terminology “possible sarcopenia” to identify the early signs of sarcopenia and allow prompt health education, nutritional strategies, and exercise interventions.9) The AWGS suggested using either calf circumference (CC) or the Strength, Assistance with walking, Rise from a chair, Climb stairs and Falls (SARC-F) or SARC-Calf to identify individuals with possible sarcopenia. Possible sarcopenia was diagnosed based on handgrip strength (HGS) or 5-time chair stand test results.9)
Other than age, sarcopenia is also significantly associated with other factors such as household status, lifestyle, physical inactivity, poor nutritional and dental status, and diseases8,9); however, evidence is limited in the stroke population.7) To the best of our knowledge, no published findings are available regarding possible sarcopenia in the community-dwelling older stroke population in Malaysia. Thus, the objectives of this study were to assess the prevalence of possible sarcopenia among older stroke survivors attending outpatient clinics and to determine the factors associated with possible sarcopenia among different age groups.
MATERIALS AND METHODS
Study Design and Setting
This cross-sectional study was performed in three public hospitals with the highest stroke cases in 2015–2016 in the East Coast region of Peninsular Malaysia from May to August 2019. The statistics of stroke cases discharged from public hospital registries were obtained from the Health Informatics Centre, Ministry of Health Malaysia. A clinical dietitian applied convenience sampling to screen and recruit all patients with stroke attending the neurology and rehabilitation departments. The same clinical dietitian performed the survey by rotating between the three hospitals to minimize evaluation errors.
Participants
This study included older adults with stroke (age ≥60 years) diagnosed with stroke as confirmed by a medical doctor and able to communicate in Bahasa Melayu. Patients with contracture deformity, amputation, or severe organ failures were excluded. A proxy respondent who was the primary caregiver (spouse, parent, child, or sibling) was recruited if the respondent presented with severe language, vision, or cognitive impairments. Older adults with stroke and their caregivers were approached during the awaiting hours in the outpatient clinics.
Sample Size
A previous study reported a 14% prevalence of sarcopenia among middle-aged and older stroke adults.5) Based on the single proportion formula, a 95% confidence interval (CI), and a 10% non-response rate, a total of 206 respondents were required in this study.10)
Dependent Variable
Definition of possible sarcopenia
We diagnosed possible sarcopenia as the presence of decreased CC (males: <34 cm, females: <33 cm) and low HGS (males: <28 kg, females: <18 kg).9) CC was measured using a measuring tape with the participant in the seated or supine position with the non-paretic knee bent at 90°. For patients with bilateral stroke, the CC of both sides were measured, and the maximum values were reported. HGS was measured using a Takei Digital Grip Strength Dynamometer (Model T.K.K.5401; Takei Scientific Instruments, Niigata, Japan)11) with the participant in the standing or seated position with a fully extended elbow. Each hand (left and right) was tested twice, with a 60-second rest in between measurements. All readings were recorded in kilograms (kg) and the maximum mean HGS of either left or right hand was reported.
Independent Variables and Measurements
Sociodemographic and clinical profiles
The independent variables included sociodemographic profiles, clinical characteristics, anthropometric measurements, dietary intake, physical activity (PA) levels, and health-related quality of life. We extracted data on participant comorbidities including hypertension, diabetes mellitus, hyperlipidemia, atrial fibrillation, and ischemic heart disease from their medical records based on the Malaysian Clinical Practice Guidelines.12-14) We also asked the participants whether they frequently faced problems (Yes or No) such as chewing, swallowing, loss of appetite, speech, memory, sleeping at night, and paresis of the dominant arm.
Anthropometric measurements
Anthropometric measurements included weight, height, mid-upper arm circumference, and waist circumference. Weight was measured to the nearest 0.1 kg using a Seca Model 803 digital weighing scale (Seca, Hamburg, Germany). Height was assessed using a stadiometer Seca 206 (Seca, Hamburg, Germany) to the nearest 0.1 cm. The height of participants with balance and gait problems was estimated using knee height and prediction equations derived in a previous study on the Malaysian older adult population.15) Body mass index (BMI) was also calculated. Waist circumference was measured using a measuring tape placed at the midpoint between the lower margin of the least palpable rib and the top of the iliac crest.16) Mid-upper arm circumference was measured on the non-paralytic arm using a measuring tape from the midpoint on the triceps between the process acromion and olecranon process.
Malnutrition risk
We screened the participants for malnutrition risk based on the Malnutrition Risk Screening Tool-Hospital (MRST-H) validated in the older adult Malaysian population.17) The MRST-H contains five items. Three items are related to financial dependency, feeding dependency, and significant unintentional weight loss. The other two items in the MRST-H involve anthropometric measurements to assess muscle wasting/malnutrition based on sex-specific cut-off points for mid-upper arm circumference (MUAC) and CC. A score is allocated to each question with a positive answer (answering yes) or an MUAC and CC below the cut-off points. An individual is classified as having high malnutrition risk if he or she has scores 2 or above.17) The MRST-H scale has an excellent overall diagnostic accuracy in discriminating malnourished groups, with an area under the curve (AUC) of 0.84 when validated against the Subjective Global Assessment.17)
Dietary intake
A clinical dietitian assessed the dietary intake of the participants using the 7-day Dietary History Questionnaire through face-to-face interviews.18) The participants were asked to recall all food and beverages consumed for the past 7 days. Dietary analysis was conducted using the Nutritionist Pro nutrition analysis software (Axxya Systems, Redmond, WA, USA) to calculate the daily mean intakes of energy, protein, carbohydrate, fat, vitamin A, vitamin C, potassium, calcium, and iron. The energy and protein intakes were presented in kcal/kg ideal body weight (IBW)/day to prevent over- or underestimation of nutrient intake. We calculated IBW for older adults by multiplying a BMI of 25 kg/m2 by the participants’ actual height squared. Adequate energy and protein intakes were defined as the consumption of at least 25 kcal/kg IBW/day and 1.0 g/kg IBW/day, respectively.19)
PA levels
The weekly PA levels were assessed using the short Malay version of the International Physical Activity Questionnaire (IPAQ).20) The IPAQ comprises seven items with four activity domains (vigorous, moderate, walking, and sitting). Each participant was asked to report the amount of time (in minutes) and the number of days (per week) spent on each activity domain. The participants were classified as achieving the recommended PA if they had total metabolic equivalents of task values-minutes per week of 600 or above (equivalent to moderate-to-vigorous activity levels).21)
Health-related quality of life
The health-related quality of life of participants was assessed using the Malay version of the EuroQoL-5 Dimensions-5 Levels (EQ-5D-5L) questionnaire validated in the Malaysian population.22) The participants were asked to rate their health on the day of evaluation based on a 5-point scale, indicating increasing severity of problems (1=no problems, 2=slight problems, 3=moderate problems, 4=severe problems, and 5=extreme problems). The EQ-5D-5L description system contains five dimensions: mobility, self-care, usual activities, pain/discomfort, and anxiety/depression. Based on the rating of the five main dimensions of the descriptive system, we generated an EQ-5D summary index based on the equation proposed by Shafie et al.23) for the Malaysian population. The EQ-5D summary index ranged from 0 (death) to 1 (full health), with negative values representing states worse than death. The participants were also asked to self-rate their “health today” based on a scale of 0–100 (from worst to best score) using the EQ-visual analogue scale (VAS).
Ethics Approval
We performed all methods in this study in accordance with relevant guidelines and regulations. The Medical Research and Ethics Committee in the Ministry of Health, Malaysia (No. NMRR-19-4024-47231 (IIR)) and the UniSZA Human Research Ethics Committee approved the study protocol before commencing the study (No. UniSZA/UHREC/2019/102). Written informed consent was obtained from cognitively intact older adults with stroke or from a proxy if the participants had severe aphasia or hearing, vision, or cognitive issues. Also, this study complied the ethical guidelines for authorship and publishing in the Annals of Geriatric Medicine and Research.24)
Statistical Analysis
Continuous variables are presented as either mean±standard deviation or median (interquartile range) based on the normality of data. Categorical variables are presented as frequencies and percentages. We performed binary logistic regression to examine factors associated with possible sarcopenia in different age groups (60–69 years and ≥70 years) because age is a well-known factor for sarcopenia. We included factors with a p-value of <0.25 in univariable analysis and of clinical importance (sex and protein intake per kg IBW per day) in multivariable logistic regression. Variables with small cells (≤5) were excluded from multivariable logistic regression. The magnitudes of the associations are presented as adjusted odds ratio (AOR) with 95% CI. Interactions and multicollinearity between variables were also checked. All statistical analyses were performed using IBM SPSS Statistics for Windows, version 25.0 (IBM Corp., Armonk, NY, USA), with a p-value of <0.05 considered statistically significant.
RESULTS
A total of 448 patients with stroke was screened, and 237 of them were excluded based on the selection criteria. A total of 211 respondents completed the survey; however, we included only 196 respondents in the data analysis because 15 of them had unknown types of strokes. The mean age of the participants was 67.60 ± 5.70 years. Two-thirds of the participants (66.3%) were aged 60–69 years; the remaining participants were aged ≥70 years. Approximately half of the participants were in the chronic phase of stroke (>6 months from stroke onset). More than half of the participants were males (51.1%), married (73.0%), of Malay origin (86.7%), and not working (96.9%). Primary education levels were reported by 43.4% of the participants. The stroke cases were predominantly ischemic stroke (84.7%) and first-ever stroke (78.1%). Hyperlipidemia (95.9%) was the leading comorbidity, followed by hypertension (94.4%), diabetes mellitus (55.6%), ischemic heart disease (13.8%), and atrial fibrillation (7.1%). Most participants were non-smokers (63.8%), whereas 33.1% were ex-smokers and 3.1% were active smokers at the time of the survey. The prevalence of possible sarcopenia was 42.3% among the older adults with stroke.
Table 1 shows that the prevalence of possible sarcopenia was significantly higher in the advanced age group (≥70 years) than in the 60–69-year age group (63.6% vs. 31.5%). Additionally, the advanced age group had significantly lower educational level (59.1% vs. 35.4% had achieved primary education level), fat (45.43 ± 13.26 vs. 50.24 ± 14.39 g/day) and iron (11.01 (4.24) vs. 12.24 (5.71) mg/day) intakes, BMI (23.08 ± 4.38 vs. 24.53 ± 4.71 kg/m2), and ED-5D index (0.54 (0.57) vs. 0.69 (0.47)) than their counterparts. Inadequate energy (59.1% vs. 46.2%) and protein (63.6% vs. 58.5%) intakes, high malnutrition risk (45.5% vs. 43.8%), and physical inactivity (71.2% vs. 71.5%) were common, with no significant differences between the two age groups. The two groups also did not differ significantly in the presence of difficulties in chewing, swallowing, loss of appetite, memory, speech, sleeping, and paresis of the dominant arm.
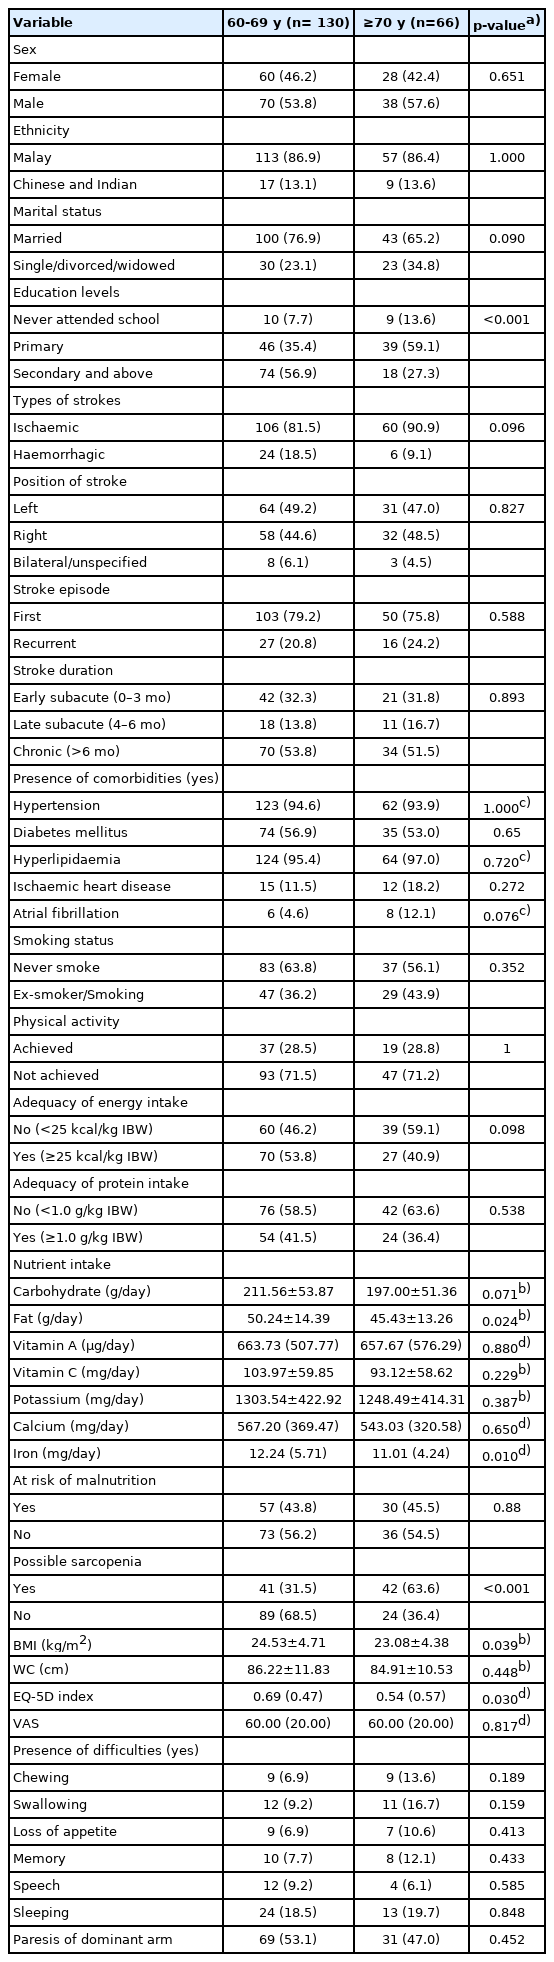
Comparison of sociodemographic, clinical, nutritional status, lifestyle practices and health-related quality of life between different age groups (n=196)
Table 2 compares the anthropometric measurements and possible sarcopenia status by sex. Individuals without possible sarcopenia had significantly higher MUAC, CC, WC, BMI, and HGS than those with possible sarcopenia regardless of sex.
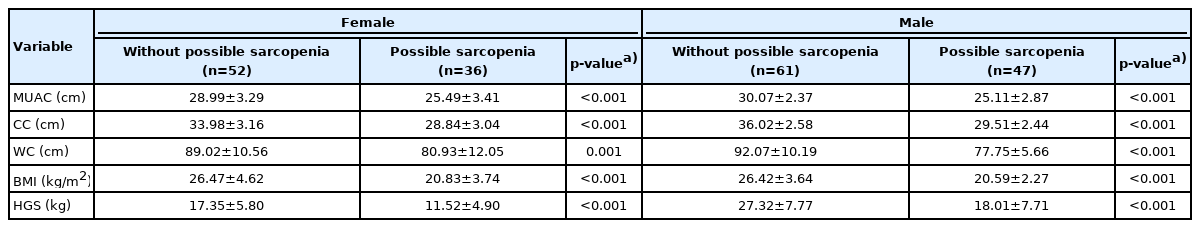
Comparison of the anthropometric measurements and possible sarcopenia status within females and males
Table 3 compares the characteristics of individuals with and without possible sarcopenia according to age group. The 60–69-year age group showed a higher prevalence of possible sarcopenia among individuals who failed to meet the PA and energy recommendations; had lower CHO and fat intake; had high malnutrition risk; had lower BMI, WC and HRQoL values (EQ-5D index and VAS); and had frequent problems with chewing, swallowing, loss of appetite and speech. Meanwhile, the advanced age group showed a significantly higher prevalence of possible sarcopenia among individuals who failed to meet the PA and energy recommendations; had lower CHO intake; had high malnutrition risk; had lower BMI, WC, and EQ-5D index values; and were ex- or active smokers.
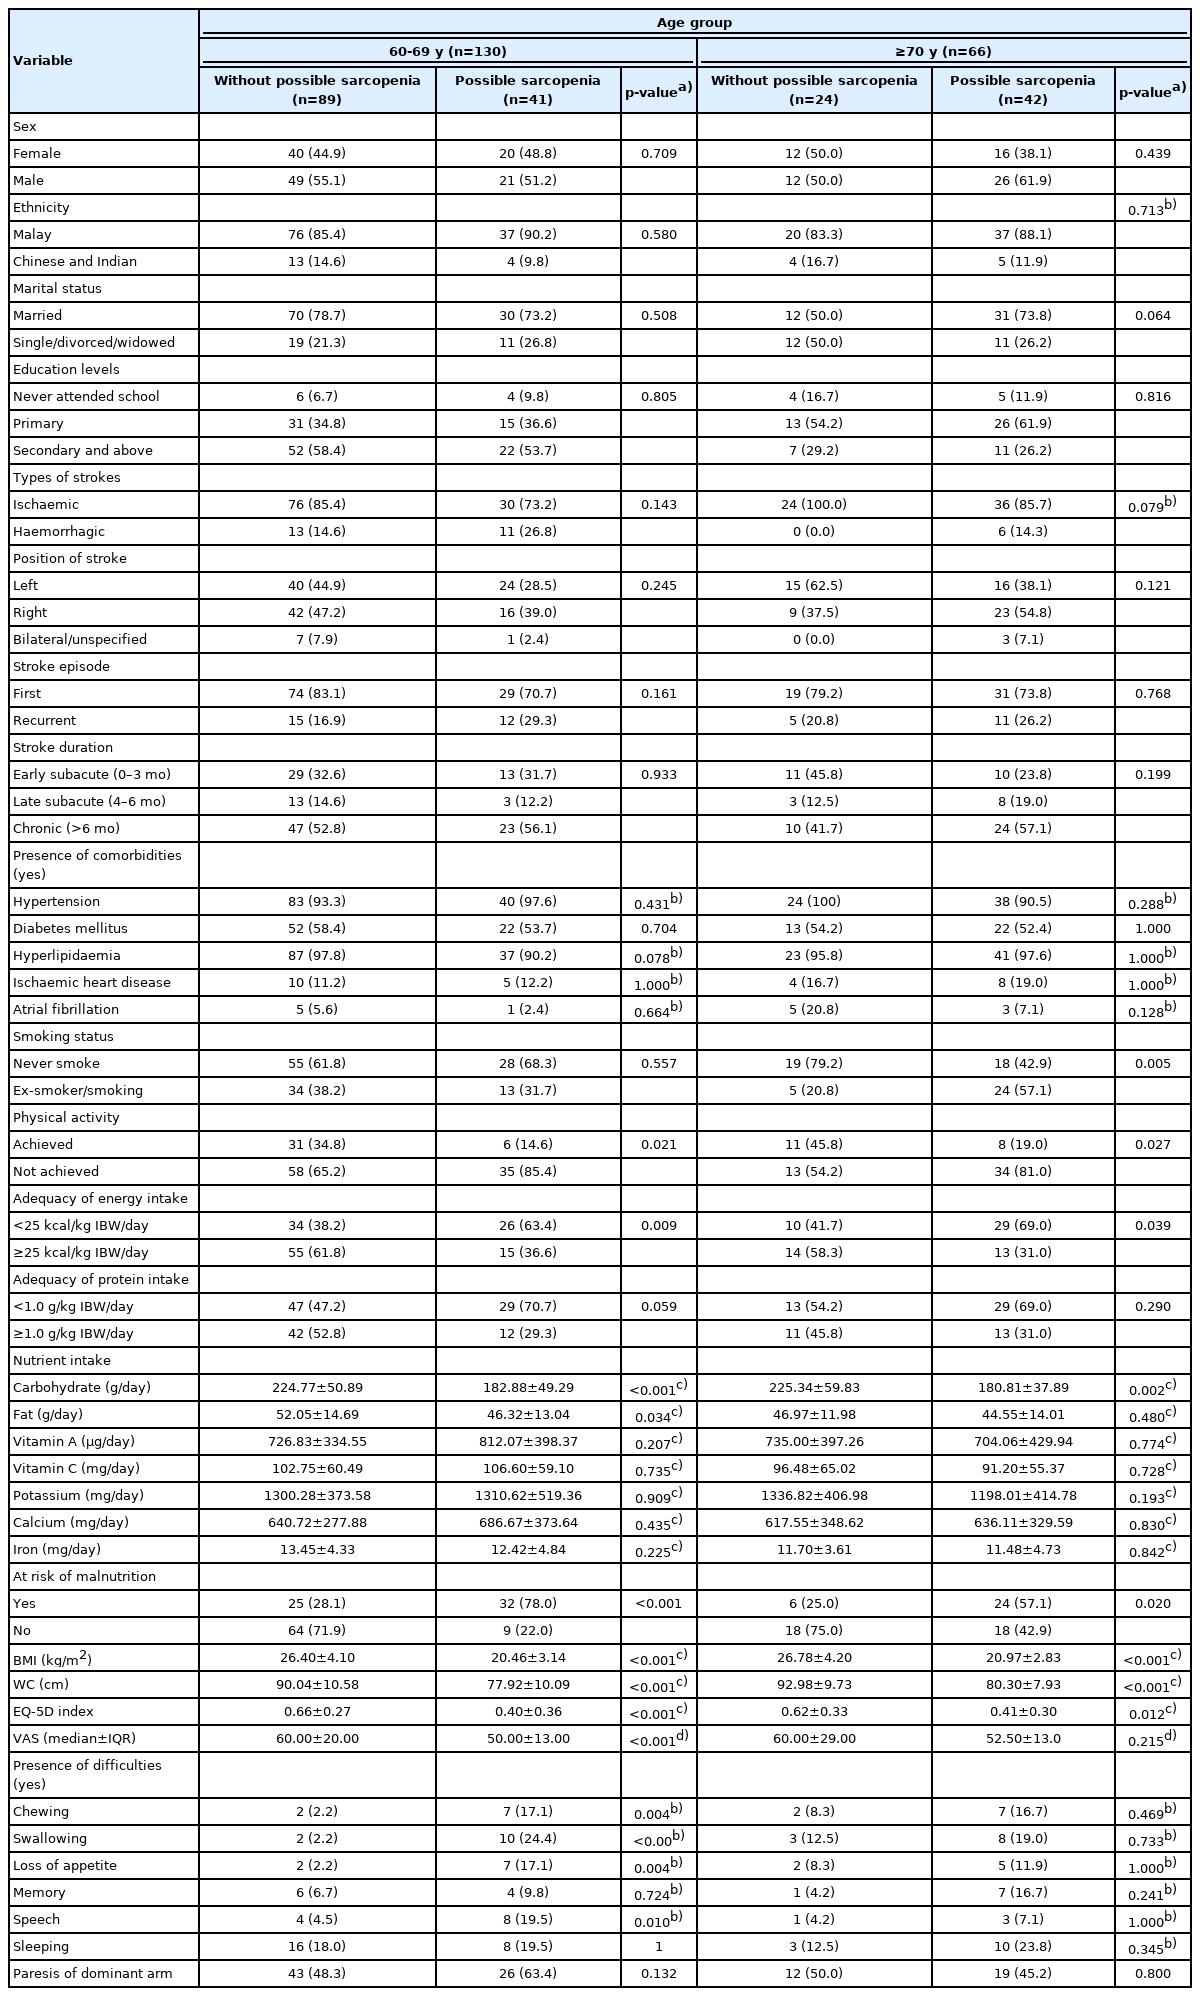
Comparison of sociodemographic, clinical, nutritional status, lifestyle practices and health-related quality of life between group without possible sarcopenia and possible sarcopenia within different age groups
Table 4 shows that in univariable analysis, both age groups shared similar factors related to possible sarcopenia. Participants who failed to meet the PA or energy recommendations were three times more likely to have possible sarcopenia. Similarly, participants with high malnutrition risk were 4–9 times more likely to have possible sarcopenia. In contrast, increasing CHO intake, BMI, WC, and EQ-5D index were associated with lower odds of having possible sarcopenia in both age groups. Moreover, every increase in fat intake and VAS score was associated with a lower risk of possible sarcopenia in the 60–69-year age group. Ex-smokers and smokers were five times more likely to have possible sarcopenia in the advanced age group. Multivariable analysis showed that recurrent stroke (AOR=3.48; 95% CI, 1.02–11.92), BMI (AOR=0.64; 95% CI, 0.54–0.76), and EQ-5D index (AOR=0.15; 95% CI, 0.03–0.78) remained significant in the 60–69-year age group after adjusting for confounding variables. Meanwhile, only BMI (AOR=0.57; 95% CI, 0.43–0.75) remained significant in the advanced age group.
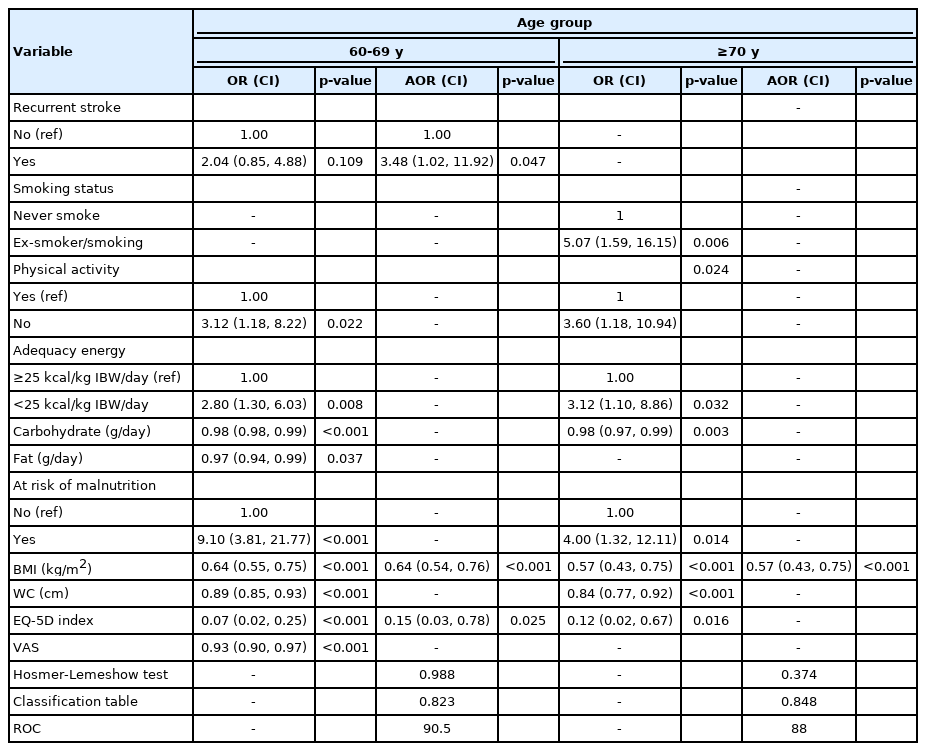
Factors associated with possible sarcopenia at univariable and multivariable analysis
DISCUSSION
The results of this study revealed a few important findings. First, the prevalence of possible sarcopenia among older stroke survivors was high, at 42.3%, and was higher in the advanced age group (≥70 years) than in the 60–69-year age group. Second, a higher BMI was significantly associated with a lower risk of possible sarcopenia regardless of age. Participants in the younger age group (60–69 years) with recurrent stroke were more likely to have possible sarcopenia. Conversely, a higher EQ-5D index in this age group was significantly associated with a lower risk of having possible sarcopenia.
The prevalence of possible sarcopenia in the Malaysian stroke population was high and deserves attention from healthcare professionals for further evaluation and treatment. Other Asian studies in Japan and Korea reported the prevalence of sarcopenia diagnosis ranging from 31% to 60% among patients with stroke.6,25,26) Although these findings are not directly comparable, Ueshima et al.27) demonstrated the high diagnostic accuracy of possible sarcopenia based on its sensitivity, specificity, and F-value. Possible sarcopenia (diagnosed based on CC and HGS) predicted sarcopenia among Japanese men and women with a sensitivity of 0.71 and 0.71, specificity of 1.00 and 0.94, and F-value of 0.83 and 0.71, respectively. Due to resource constraints, we were unable to perform confirmatory diagnosis of sarcopenia following diagnostic protocols. However, the AWGS (2019) suggested the initiation of lifestyle interventions among individuals with possible sarcopenia regardless of the final diagnosis. More research is needed to explore the usefulness of using possible sarcopenia for predicting sarcopenia diagnosis in the Malaysian population.
The results of this study add to the growing body of evidence showing that the syndrome of sarcopenia is multifactorial, with relationships to age, disease, inactivity, and poor nutrition. Unsurprisingly, advanced age was significantly associated with possible sarcopenia, consistent with findings of other Asian studies.27,28) Muscle tissue gradually decreases during aging, resulting in decreased muscle mass and strength.
Moreover, increasing BMI was significantly associated with lower odds of having possible sarcopenia regardless of advanced age, also consistent with previous studies of community-dwelling older adults with stroke or those admitted to the convalescent rehabilitation ward.7,27) Indeed, the participants with possible sarcopenia in this study were significantly thinner (20.7 ± 3.0 vs. 26.5 ± 4.1 kg/m2) than their counterparts. Landi et al.29) reported a lower risk of sarcopenia among older adult individuals with BMI of >21.0 kg/m2 than the risk among those with BMI of <21 kg/m2 in nursing homes of Italy. Cheng et al.30) suggested that higher fat mass can have several age-rated effects on lean mass. Individuals with higher fat mass might consume higher protein, which is important for sarcopenia prevention. Our results showed that BMI was weakly to moderately correlated with total energy (r=0.520, p<0.001) and protein intake (r=0.398, p<0.001). Despite this, the accurate measurement of BMI could be challenging among older adults with stroke and hemiparesis. Additionally, older adults with stroke show more prominent body composition changes than healthy older adults.31). Chang et al.31) showed a significantly lower bone mineral content, lower lean mass, and higher trunk fat mass among older adult Taiwanese patients with stroke (stroke duration ≥6 months) than healthy older adults of similar age. The study postulated that stroke-induced malnutrition, accelerated protein degradation secondary to chronic inflammation, and bone loss following physical inactivity might have explained the decrease in lean body mass and bone minerals in patients with stroke. Thus, other than BMI, body composition evaluation should be integrated into routine clinical practice for older adult patients with stroke to allow more accurate nutritional screening and assessment.
Individuals with possible sarcopenia in our study also showed a significantly overall poor quality of life, consistent with previous findings.32) Further exploration showed that possible sarcopenia was significantly associated with the physical dimension of HRQoL, namely, mobility, self-care, and usual activities. Sarcopenia is characterized by loss of lean body mass and muscle function, which are required for physical functioning in stroke survivors. Matsu et al. showed that sarcopenia was a predictor of activities of daily living capability in patients with stroke undergoing rehabilitation.33) Improvement in sarcopenia was also associated with better functional and discharge outcomes among patients with stroke undergoing rehabilitation.34)
Additionally, participants with recurrent stroke were more likely to have possible sarcopenia. However, this factor was only significant in the younger age group. Recurrent stroke is often more severe, fatal, and disabling than the first episode.35,36) Thus, these patients were more likely to experience severe dysphagia, hemiparesis, and cognitive impairment, which may hinder their abilities to be mobile and consume adequate food.
This study also found that individuals who failed to consume adequate energy intake were more likely to have possible sarcopenia, although the relationship lost its significance in the multivariable analysis. Other studies have demonstrated that older adults with sarcopenia consumed significantly lesser energy, protein, vitamins (vitamin B12 and vitamin D), and minerals (potassium, calcium, magnesium, and selenium) than those without sarcopenia.35,36) Our study results showed that the adequacy and quality of nutrient intake among older adult patients with stroke deserve more attention since these patients generally consumed less than the recommended values (24.20 ± 5.25 kcal/kg IBW/day; 0.95 ± 0.22 g protein/kg IBW/day; potassium 1285 ± 419.8 mg/day; calcium 646.5 ± 318.0 mg/day). Kakehi et al.37) recommended the consumption of 25–35 kcal/kg BW/day and 1.2–1.5 g/kg BW/day protein during the subacute phase (2–4 weeks after stroke onset) and subsequently more energy to match the PA level during the convalescent phase to prevent sarcopenia. The dietary inadequacy among patients with stroke might be explained by the presence of oral dysfunction such as chewing, swallowing, and speech difficulties. Thus, texture modification, appropriate use of nutritional supplements, and oral rehabilitation strategies may help achieve adequate energy and protein intakes in these patients.
Similarly, univariable analysis in this study showed that possible sarcopenia was significantly associated with physical inactivity. Physical inactivity and immobilization after stroke can decrease muscle protein synthesis and reduce leg lean mass, leading to reduced muscle strength.38) The International Clinical Practice Guidelines For Sarcopenia strongly recommend resistance exercise and conditionally recommend protein supplementation/protein-rich diet in sarcopenia treatment.39) Multimodal exercises including a combination of resistance, aerobic, walking, and balance training are also recommended.40) Thus, attention should be paid to increase the PA levels of older adult patients with stroke to prevent sarcopenia and its complications.
The study has some limitations. First, we could not fully clarify the causal relationship between possible sarcopenia and its associated factors due to the cross-sectional study design. Second, we did not examine important variables such as severity of stroke and degree of disability as these data were either largely missing or required a manual search in the patient records. Third, we did not report on important nutrients such as vitamin D, omega 3 fatty acids, selenium, and magnesium because they were largely absent in the Malaysian Food Composition Database.41) Fourth, the measurements of CC and HGS may vary according to posture, which might have affected the diagnostic accuracy. Xu et al.42) reported the highest HGS measured while standing with the elbow fully extended, followed by standing with the arm raised, sitting with the elbow fully extended, and sitting with the elbow flexed 90º among 764 healthy Chinese individuals. They observed no significant differences in HGS among participants sitting with either elbow flexed or fully extended. In contrast, Jeong et al.43) reported a significantly lower CC when standing than when sitting regardless of the measurement side among community-dwelling Korean older adults. Although the AUC values of CC did not differ significantly when measured in different postures and sides, the AUC of right CC was largest when validating against the sarcopenia criteria according to the AWGS. Fifth, we did not perform an alternative method of sarcopenia screening, namely, SARC-F and 5-time chair stand test; thus, comparison of screening results between different methods was unlikely. Previous studies have suggested that SARC-F might underestimate the prevalence of possible sarcopenia among community-dwelling healthy older adults in Asian countries.44,45) Additionally, the presence of cognitive decline might have influenced the accuracy of the results as the SARC-F is a self-report questionnaire; thus, it depends on a participant’s ability to accurately estimate their physical abilities.46) In contrast, Yao et al.47) showed that when validated against the 2019 AWGS diagnostic criteria among patients with stroke in China, the sensitivity and specificity of the sarcopenia screening tools were as follows: SARC-F (sensitivity of 94.7%; specificity of 40.0%), Ishii’s score (sensitivity of 90.1%; specificity of 36.0%), and CC alone (sensitivity of 81.8%; specificity of 90.1%). Ishii’s score was derived from a sex-specific formula that included age, HGS, and CC values. However, they used revised cut-off points for screening when validated against the diagnostic criteria. Therefore, further research is needed to confirm the diagnostic efficacy of these screening tools among patients with stroke, and the most appropriate cut-off values is highly recommended. Sixth, the presence of cognitive decline among the elderly might have influenced the accuracy of the self-reported information for dietary intake and physical activity, although a proxy of the respondent was used to improve the response rate. Finally, the presence of possible sarcopenia before stroke was not addressed in this study because the screening of sarcopenia was not routinely conducted in the acute stroke phase and thus should be examined in future cohort studies.
Despite these limitations, this is one of the very few studies in Malaysia to examine the prevalence of possible sarcopenia among stroke survivors and its association with multiple dimensions of factors. Another point warranting discussion is stroke-related sarcopenia. Sarcopenia is caused not only by aging also by various factors. Stroke-related sarcopenia is a new concept that deserves attention and future clinical studies to elucidate its pathophysiology, early identification, prevention, and treatment. Moreover, the clinical impacts and associated complications of stroke-related sarcopenia on individuals with stroke have not been thoroughly studied and understood.
In conclusion, the prevalence of possible sarcopenia among community-dwelling older stroke survivors was high at 42.3%, with a higher prevalence in the more advanced age group (≥70 years). Furthermore, possible sarcopenia was significantly associated with BMI, recurrent stroke, and health-related quality of life in this population. Sarcopenia is often overlooked; therefore, we highly recommend screening for possible sarcopenia to allow early nutritional and exercise interventions.
Notes
The authors would like to thank the Director-General of Health Malaysia for permission to publish this article. The authors would like to express their greatest gratitude to all site investigators: Dr. Rafidah Dato Abdullah, Dr. Rahimah Binti Nawi, and Dr. Sulaila Binti Basiam. The authors are also thankful to all respondents and their caregivers who participated in the study.
CONFLICT OF INTEREST
The researchers claim no conflicts of interest.
FUNDING
None.
AUTHOR CONTRIBUTIONS
Conceptualization, HJW, SH, PLL, and KAI; Data curation, HJW; Funding acquisition, SH; Investigation, HJW; Methodology, HJW, SH, PLL, and KAI; Project administration, HJW; Supervision, SH, PLL, and KAI; Writing–original draft, HJW; Writing–review & editing, SH, PLL, and KAI.