


INTRODUCTION
Life expectancy has steadily increased in the recent decades. Moreover, the global prevalence of older adults has increased, owing to a decrease in birth and death rates.1,2) Obesity is an important public health concern that is increasing in the older population and society. In the United States during the 90s, there were approximately 32 million older adults and 26.1% of them had a body mass index (BMI) >30 kg/m2, while in 2008, there were approximately 40 million older adults and 39.5% had a BMI over 30 kg/m2.3) Moreover, according to the Korean National Health Insurance Database, the prevalence of obesity among adults aged 70–79 years has increased from 31.7% in 2006 to 36.6% in 2015. The prevalence of obesity among those over 80 years old was 21.9% in 2006 and increased to 27.5% in 2015.4) In Turkey, the prevalence of obesity in the adult population is >30%. Although the prevalence of obesity is higher in women, its rapid increase in men has also drawn attention in recent years.5)
Obesity among older adults is most likely the result of consuming more calories than expending energy. Decreased basal metabolic rate and physical activity levels in the older adults are important contributors to obesity.6) Often, in older adults, changes in body composition, such as an increase in fat mass and decrease in muscle mass, are observed. Obesity is pathophysiologically complex in older adults compared to that in young and middle-aged adults. This complexity makes it difficult to identify obesity-related comorbidities and creates clinical uncertainty in terms of weight management.1) It should also be noted that some studies in older adults with cardiovascular disease, cancer, and stroke have found that overweight and obese patients have a lower risk of mortality. This situation is known as the obesity paradox.7,8) Therefore, it is not clear which BMI range is most beneficial for older adults in terms of outcomes, such as functionality, risk of falls, nutritional status, and strength. Although some studies have investigated associations between obesity or BMI and geriatric conditions, the present study is the first to examine associations between many geriatric assessment parameters, such as nutritional status, cognitive and functional status, gait and balance, and muscle strength and BMI groups, simultaneously.9)
The aim of the present study was to identify a suitable BMI range that can minimize negative clinical results in geriatric patients, based on geriatric evaluation parameters.
MATERIALS AND METHODS
Participants
Data were utilized from 2,335 older adults who were admitted to a geriatric outpatient clinic in Turkey between January 2017 and November 2020. After obtaining ethics committee and institutional approval of Bezmialem Vakif University (No. 10/29) for the present study, the data were retrospectively analyzed. A total of 1,312 people with either a diagnosis of dementia or history of cerebrovascular disease, and those with missing data were excluded from the study. The final sample included 1,051 patients aged >65 years. Informed consent was obtained from all the participants included in the study.
Comprehensive Geriatric Assessment
Demographic information (patient age, sex, marital status, people whom they live with), height, weight, BMI, calf circumference measurements, number of drugs used, history of falls in the last year, Barthel basic daily living activities scale (BADL), Lawton instrumental daily living activities scale (IADL), Tinetti balance and gait scale, Mini Nutritional Assessment (MNA) test, Geriatric Depression Scale-15, Mini-Mental State Examination (MMSE), Time Up and Go test (TUG), and handgrip strength (HGS; three measurements were made from the dominant hand and the highest value was taken). According to these parameters, BADL (score ≥91), IADL (score ≥17), Tinetti total (score >19), TUG (< 13.5 s), MNA (score >23.5), GDS (score <5), MMSE (score ≥23), and HGS (female ≥16 kg, male ≥27 kg) were considered healthy.10-17)
Evaluation of Weight Status
BMI was defined as the person’s weight in kilograms divided by the square of the person’s height in meters (kg/m2). The World Health Organization (WHO) categorizes BMI for adults over the age of 20 years as follows: underweight, <18.5 kg/m2; normal weight, 18.5–24.9 kg/m2; pre-obesity, 25–29.9 kg/m2; stage 1 obesity, 30–34.9 kg/m2; stage 2 obesity, 35–39 kg/m2; and stage 3 obesity, >40 kg/m2.18)
Statistical Analysis
IBM SPSS Statistics 22.0 program (IBM, Armonk, NY, USA) was used for statistical analysis. Descriptive statistics were used to assess the central tendency and distribution of the study variables (e.g., mean, standard deviation, median, and frequency). Skewness and kurtosis values were used together with the Shapiro-Wilk test to assess for normal distribution of the data. One-way ANOVA and Kruskal-Wallis tests were used to evaluate more than two normally and non-normally distributed variables, respectively. The chi-squared test was used to evaluate the relationships between the variables. The cutoff scores were assessed using the receiver operating characteristic (ROC) curve. Sensitivity and specificity were calculated for different BMI cutoff scores to detect the desirable cutoff values of BADL, IADL, MNA, Tinetti, TUG, MMSE, GDS, and HGS. After evaluating all BMI cutoff values, the optimum BMI values were determined according to the optimum sensitivity and specificity. The p-values for each area under the curve (AUC) from the ROC were determined. The results were evaluated using a 95% confidence interval, and significance was set at a level of p<0.05.
RESULTS
General Characteristics
A total of 1,051 people, 768 female (73%) and 283 male (27%) were included in the study. The mean age of the participants was 77.22±7.10 years (range, 65–103 years), with the mean age for male and female being 78.41±7.39 and 76.77±6.94 years, respectively. There was a statistically significant difference in the ages of male and female (p=0.002).
The mean BMI of the sample was 30.79±5.77 kg/m2 (range, 18.5–56) with the mean BMI being 28.12±4.37 kg/m2 for male and 31.71±5.92 kg/m2 for female. There was a significant difference in the BMIs of male and female (p<0.001). When female and male were evaluated separately, similar results were obtained. Moreover, when patients aged <80 years were evaluated, BMI was thought to be independent of age. The general characteristics of both sexes are shown in Table 1.
The patients were divided into groups according to WHO BMI criteria—Group 1 (BMI 18.5–24.9), Group 2 (BMI 25–29.9), Group 3 (BMI 30–34.9), Group 4 (BMI 35–39.9), and Group 5 (BMI ≥40). A total of 181 (17.2%) patients were living alone, 544 (51.8%) with their spouses, 173 (16.4%) with their children, and 153 (14.6%) with someone else (caregiver, relative, etc.).
The mean number of drugs used was 5.08±3.11 (range, 0–15), with that being 4.9±3.39 for male and 5.15 ± 3.00 for female, and there was no statistically significant difference between female and male (p=0.261). The number of drugs (5.51±3.13) used by those who stated that they had fallen in the past year was significantly higher than that used by those who had no falls (4.86±3.06) (p=0.003).
Relationships between Geriatric Assessment Parameters and BMI Groups
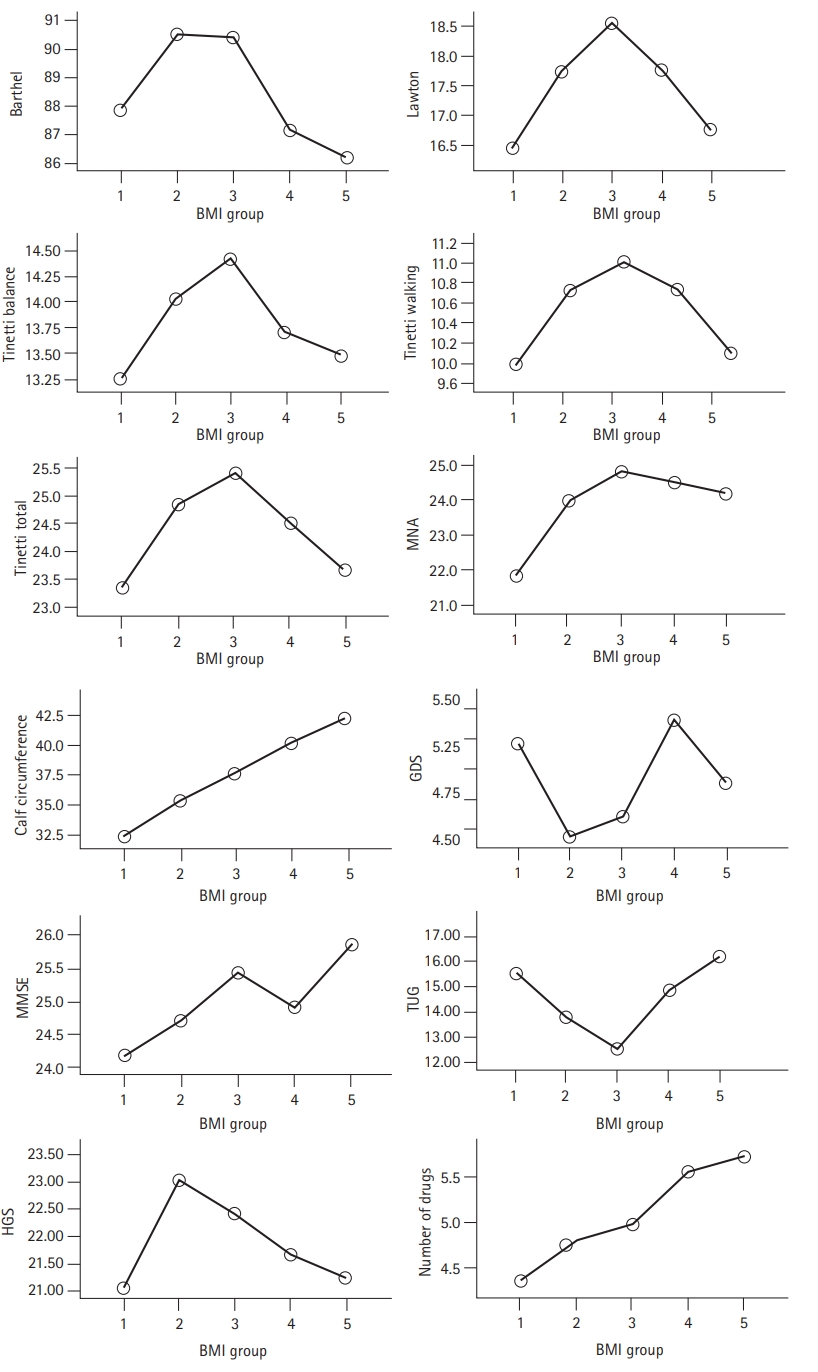
In the evaluation of the correlation between geriatric assessment parameters and BMI, a significant negative correlation was found between the Tinetti balance test and BMI. A significant positive correlation was observed between Tinetti walking, MNA, calf circumference, MMSE score, number of drugs used by individuals, and BMI (p<0.05). Fig. 1 and Table 2 show the associations between BMI groups and geriatric assessment parameters.
Determination of Optimum Cutoff Points
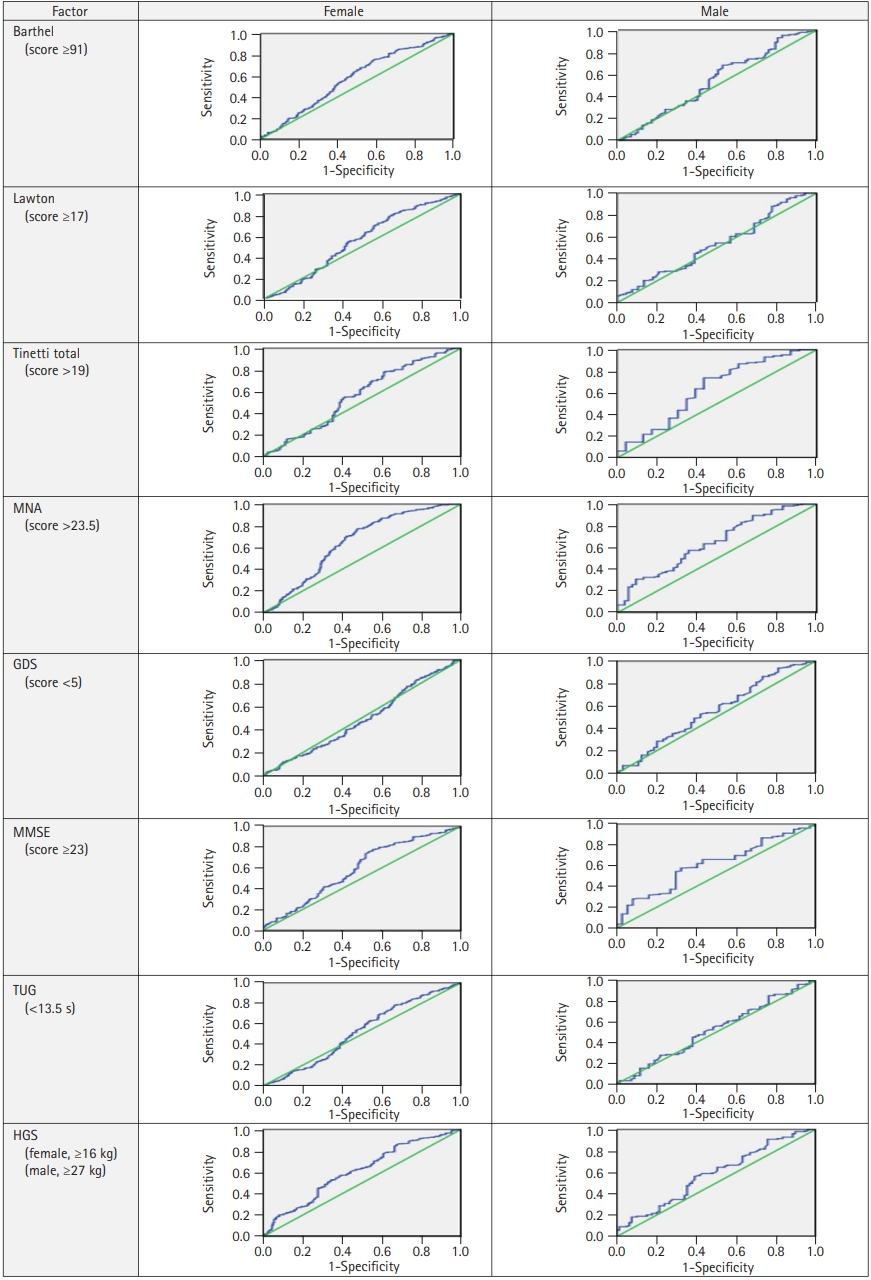
ROC analysis for the optimum BMI in older women and men who were healthier according to the cutoff values of BADL, IADL, MNA, Tinetti, TUG, MMSE, GDS, and HGS are shown in Table 3. ROC analysis of the optimum BMI cutoff levels (Table 3) to detect the desirable values of these geriatric assessment parameters is shown in Fig. 2. Table 3 and Fig. 2 complement each other in this regard. The optimum BMI values were 31–32 kg/m2 for female and 27–28 kg/m2 for male (Table 3).
When the relationship between chronic diseases and BMI groups was evaluated, hypertension, diabetes mellitus, and chronic obstructive pulmonary disease (COPD) were more prevalent in patients with a BMI ≥30 kg/m2 than in those with a BMI <30 kg/m2 (p<0.05) (Supplementary Table S1).
DISCUSSION
Obesity is an important public health issue that is increasing among the older adult population as well as in the society. In the present study, 503 patients (54.6%) had a BMI >30 kg/m2. Several studies have shown that the prevalence of hypertension, metabolic syndrome, coronary heart disease, obstructive sleep apnea syndrome, and osteoarthritis increases with increasing obesity in geriatric patients and that patients require more surgical intervention.19-21) A significant difference was found between BMI groups in terms of hypertension, diabetes mellitus, and COPD prevalence in the present study as was seen in previous studies. It was observed that the frequency of these diseases increased significantly, especially when BMI was >35 kg/m2. There were no significant differences between the groups in terms of the frequency of coronary artery disease and heart failure.
Galanos et al.22) observed a J-shaped relationship between BMI and decreased muscle strength in older individuals aged 65–85 years. Weakness was found to increase in both low and high BMI values for both sexes. Obesity is a potential risk factor for undesirable surgical outcomes in older adults. Surgical complications associated with obesity include poor wound healing, risk of infection, increased operative time, and breathing difficulties.23) However, some studies have shown that 30-day postoperative mortality reduced or long-term survival improved in those who are generally overweight or have milder levels of obesity, thus supporting the obesity paradox hypothesis.8)
In the present study, a significant positive correlation was found between the number of drugs used and BMI. Moreover, a significant difference was observed between the BMI groups in terms of the number of drugs used. It has previously been found that those individuals with a BMI >35 kg/m2 consume the highest number of drugs. This may be because hypertension, diabetes mellitus, and COPD are more common in those with BMI >30 kg/m2, and the accumulation of drugs used to treat each individual’s condition increases the total number of drugs taken.
The present study showed that there was a significant difference between the BMI groups in terms of Tinetti balance, gait scale (total), and TUG test and the worst results were seen in the BMI range of 25 and >35 kg/m2, for both tests. Although there was no difference between the BMI groups in terms of HGS, the worst results were in this BMI range, similar to the Tinetti total score and TUG duration, which are predictive of fall risk and sarcopenia.24) Falsarella et al.25) evaluated the effect of muscle mass on the functionality of 99 older women and observed that decreased muscle mass was associated with walking speed and poor physical performance on TUG tests. Leyk et al.26) found that HGS is highly correlated with lean body tissue. Studies have shown that BMI is weakly correlated with HGS. The weakness of this relationship is that BMI is not an indicator of lean body tissues in individuals.27) As a result of the decrease in HGS, recovery after illness or surgery is delayed and physical function loss occurs. Indeed, there are publications showing a relationship between muscle strength and acute and chronic diseases.28,29) In our study, similar parameters (TUG, Tinetti, muscle strength) increased the fall risk among individuals with a BMI <25 kg/m2, which is considered a normal BMI. This suggests that ideal BMI values in older individuals may differ from those in the normal population. However, the risk of sarcopenic obesity increases with BMI values >35 kg/m2 and especially >40 kg/m2, and the risk of falling increases and functional capacity decreases in this group of older individuals. Thirty percent of people aged 65 years and over fall each year, and this rate increases to approximately 40% for people aged 85 years and over.30) Various degrees of injuries occur in 12%–40% of older individuals who experience a fall and 20% require medical assistance.31) In the present study, the relationship between the BMI groups and the Barthel scale, which shows functional capacity, and the Lawton scale, was evaluated. A significant difference was found between the BMI groups in terms of the Barthel and Lawton scale scores. In both scales, it was determined that the scale scores for BMI <25 kg/m2 and BMI >35 kg/m2 were lower, thus their functional capacities were lower. Therefore, it seems ideal for the older adults to have a BMI of 25–35 kg/m2 to maintain their functionality and reduce the risk of falling.
When we evaluated BMI with respect to MNA, a significant difference was found between the groups. When we examined the BMI groups, the best MNA results were in the range of BMI 30–35 kg/m2, and the MNA score tended to decrease gradually in individuals with a BMI >35 kg/m2. Our results showed that malnutrition, which is one of the most important causes of mortality and morbidity in the older, should be considered not only in individuals with low BMI but also in those with obesity.32,33)
Additionally, a strong positive correlation was found between calf circumference and BMI. Studies have found that calf circumference is correlated with other nutritional anthropometric measurements, including BMI, free fat mass, and mobility.34) The linear correlation curve showing the relationship between BMI and calf circumference, and especially the tendency of TUG to be increased for BMI of 30 kg/m2, indicates that sarcopenic obesity should not be overlooked when using a 31-cm cutoff for calf circumference screening for sarcopenia.34)
The present study also showed a significant positive correlation between BMI and MMSE score. The MMSE is a useful and standardized test that is frequently used in clinical practice for the detection of cognitive disorders, monitoring the stage of dementia and response to treatment, and epidemiological studies of dementia.35) In a meta-analysis by Beydoun et al.,36) the existence of a U-shaped relationship between BMI and dementia was demonstrated, and both obesity and underweight were associated with an increased risk of dementia. The reason for the difference in the present study may be exclusion of patients with dementia and previous cerebrovascular disease.
The findings of this study must be interpreted considering these limitations. One limitation is the possible selection bias due to the retrospective design of the study. Another limitation is the cross-sectional study design; thus, causal relationships could not be determined. Next, the metabolic syndrome was not evaluated, and only BMI measurements were used to investigate its relationship with geriatric conditions. Finally, there are no mortality data to determine the optimum cutoff BMI values in older patients; therefore, this study investigated the relationship between current geriatric assessment parameters and BMI. The strengths of the present study include large sample size and simultaneous evaluation of multiple geriatric parameters.
In conclusion, the present study suggests that the ideal BMI ranges for young and middle-aged individuals are not ideal for older patients; especially, older individuals with BMI values <25 and >35 kg/m2 have a higher risk of decreased functional capacity, balance, walking, mobilization disorders, fall risk, reduction in muscle strength, and malnutrition. Therefore, a BMI between 25 and 35 kg/m2 may be optimal for health in the older population. Data from this study suggest that the optimum BMI range is 31–32 kg/m2 for female and 27–28 kg/m2 for male. With broader studies on this subject, the ideal BMI range for older people can be determined.