Ann Geriatr Med Res Search

CLOSE


Ann Geriatr Med Res > Volume 25(1); 2021 > Article
Chung, Jang, and the Alzheimer’s Disease Neuroimaging Initiative: Comprehensive Visual Rating Scale on Magnetic Resonance Imaging: Application to Prodromal Alzheimer Disease

Abstract

Background

A comprehensive visual rating scale (CVRS) using brain magnetic resonance imaging (MRI) was previously developed to evaluate structural changes in the brains of older patients. This study investigated the usefulness of the CVRS in predicting dementia with Alzheimer disease (AD) in patients with prodromal AD.

Methods

We included 189 patients with prodromal AD with available data from the Alzheimer’s Disease Neuroimaging Initiative study. We evaluated all patients using CVRS and assessed their progression to AD dementia over 3 years of longitudinal follow-up. Survival analysis was performed using the Cox proportional hazards model to analyze the hazard ratios of the CVRS for progression to AD dementia.

Results

Among 189 patients with prodromal AD, 61 (32.3%) progressed to dementia. The mean baseline CVRS scores differed significantly between the stable and progressive groups (9.9±5.1 vs. 12.4±4.9; p=0.002). An initial high CVRS score was an independent risk factor for the progression to AD dementia (hazard ratio=1.110; 95% confidence interval, 1.043–1.182).

Conclusion

The baseline CVRS score predicted the progression to dementia in patients with prodromal AD, indicating its independent association with longitudinal cognitive decline.

INTRODUCTION

Alzheimer disease (AD) is the most common neurodegenerative disease that causes dementia. Mild cognitive impairment (MCI), a prodromal stage of dementia, is characterized by cognitive dysfunction without definite functional deficits. Prodromal AD is defined as MCI with positivity for an AD biomarker, such as amyloid deposition, on positron emission tomography (PET) imaging.1) In clinical practice, there is an increasing need for biomarkers to assess patients at high risk of progression to AD dementia among patients with prodromal AD.2)
Among the in-vivo visualization of cerebral structural changes, brain magnetic resonance imaging (MRI) is commonly used for the identification of AD and MCI.3) The diagnostic criteria include cerebral atrophy in brain MRI as a neurodegenerative marker of AD.4,5) As MCI is usually associated with various pathologies,6) the development of neuroimaging biomarkers to simultaneously reflect neurodegeneration and vascular injury is required.
A comprehensive visual rating scale (CVRS) using brain MRI was developed to assess structural changes occurring due to cerebral atrophy and vascular lesions.7) The CVRS integrates preexisting visual rating scales such as cortical atrophy, hippocampal atrophy, ventricular enlargement, and small vessel disease.7) The CVRS was previously validated for individuals with AD, MCI, and normal cognition. It was found to indicate structural changes in the brains of patients with AD and MCI and was significantly correlated with the results of neuropsychological tests.7) In addition, this scale was used to predict disease progression and its relationship to cognitive decline in longitudinal follow-ups of subjects with MCI.8) Consistent with previous studies, this longitudinal follow-up study evaluated the usefulness of the CVRS in predicting the progression to AD dementia in patients with prodromal AD.

MATERIALS AND METHODS

Study population

We downloaded data for this study from the Alzheimer’s Disease Neuroimaging Initiative (ADNI) database (http://adni.loni.usc.edu/). The principal investigator, Michael W. Weiner started the ADNI in 2003 as a public-private partnership. The primary aim of the ADNI is to determine whether the combination of serial biological markers and clinical and neuropsychological tests can be used to measure the progression of AD and MCI. The study procedures were approved by the Institutional Review Board of the Kangwon National University Hospital (No. KNUH-2020-04-015) and written informed consent was obtained from all participants or their authorized representatives. The detailed protocols regarding informed consent of the ADNI subjects and current information can be found on the ADNI webpage (http://adni.loni.usc.edu/).
We downloaded the data included in this study from the ADNI database on June 20, 2020. We included patients with prodromal AD who underwent a baseline MRI scan. The primary outcome was progression to AD dementia during a follow-up period of 36 months. This study finally included 189 patients with prodromal AD from the ADNI cohort.
MCI was diagnosed based on the presence of objective memory impairment without meeting the criteria for dementia. All subjects had a Mini-Mental State Examination (MMSE) score of ≥24, a CDR memory score of ≥0.5, a global Clinical Dementia Rating (CDR) score of 0.5, and a score for the delayed recall from Story A of the Wechsler Memory Scale-Revised of ≤2 (0–7 years of education), ≤4 (8–15 years of education) or ≤8 (≥16 years of education).9) The diagnosis of dementia at follow-up was based on the presence of memory complaints, a global CDR score of ≥0.5, and significant impairments in objective cognition and ADL.

MRI

All subjects underwent imaging studies using a 3-T MRI scanner (GE, Philips, or Siemens). Various ADNI sites collect data using a standardized MRI protocol to evaluate and compare three-dimensional T1-weighted sequences (http://adni.loni.usc.edu/methods/documents/mri-protocols/). MRI data were acquired and processed according to a standard protocol.10) We downloaded preprocessed T1-weighted magnetization-prepared rapid gradient-echo (MP-RAGE) MR images, T2 star-weighted images, and fluid-attenuated inversion recovery images from the database.

CVRS

The CVRS includes the hippocampal atrophy, cortical atrophy, subcortical atrophy (ventricular enlargement), and small vessel disease scales, which summarize degenerative or vascular injury of the pathologic brain (Table 1).11-16) A previous study described the details of each scale.7) The CVRS integrates validated scales to quantify the effects of various brain deficits, thus producing a scale score ranging from 0 to 30, with higher scores indicating more deficits.
Neurologists (JKC) who were blinded to the clinical and demographic information performed the visual rating using a template.

Pathologic changes in AD

The presence of amyloid by positron emission tomography (PET) was used to confirm the pathologic changes in AD. The mean standard uptake value ratio (SUVR) of 18F-AV-45 PET was determined for each subject. An SUVR threshold of ≥1.10 was used to define amyloid positive (Aβ+) status according to the ADNI study using the composite volume of interest (VOI) SUVR with the highest accuracy for discriminating between patients with AD and cognitively normal subjects.17)

Neuropsychological tests

Neuropsychological tests such as the MMSE, CDR-sum of boxes (CDR-SOB), and Alzheimer’s Disease Assessment Scale-cognitive subscale (ADAS-cog)18) were performed at baseline and annual follow-ups over 3 years.

Statistical analysis

We used independent t-test and chi-square test for continuous and categorical variables, respectively, to analyze group differences. We evaluated the hazard ratios (HRs) of baseline demographics, neuropsychological tests, and CVRS using univariate Cox regression analysis using follow-up time by yearly intervals as the time variable and progression to AD dementia as the status variable. To determine whether the CVRS was significantly associated with progression to AD dementia, we used Kaplan-Meier plots based on “high” and “low” CVRS according to the maximally selected rank statistics.19) We applied multivariate Cox analysis to confirm the independent determinants of AD dementia progression with relevant covariates. The retention threshold was p<0.2 in univariate Cox regression and also included clinically important variables. The MMSE and ADAS-cog scores were highly correlated and were divided into Models 1 and 2.
Statistical significance was defined as p<0.05. Statistical analyses were performed using R version 4.0.2 (The R Foundation for Statistical Computing, 64-bit platform). Cox regression analysis was performed using the survival package,20) while the optimal cutoff points of continuous variables in the “survival” analysis were determined using the “maxstat” package.19) Graphics were created using the “ggplot2” package.21)

RESULTS

This study included 189 patients with prodromal AD. Their mean age was 72.6 years and 86 (45.5%) were female. A total of 122 patients (64.5%) had at least one APOE ε4 allele. We observed that 61 patients (32.3%) progressed to dementia, while 128 patients did not, during a follow-up period of 36 months. The baseline characteristics based on the progression to dementia, categorized as stable or progressive prodromal AD, are presented in Table 2. Patients with prodromal AD that progressed to dementia had poorer cognitive performance and CVRS scores at baseline.
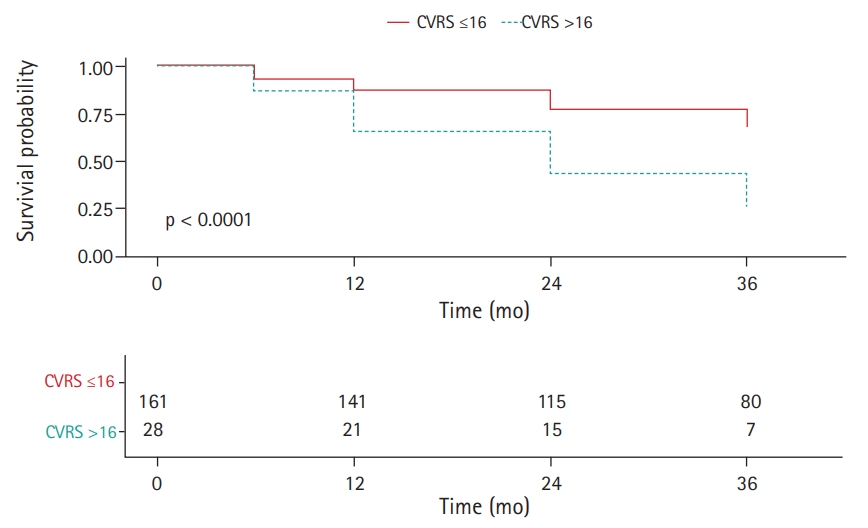
Subjects with higher CVRS scores (>16 points) had a significantly higher HR for progression to AD dementia in the univariate Cox regression analysis (HR=1.089; 95% confidence interval [CI], 1.034–1.146) (Fig. 1, Table 3). The rate of progression to AD dementia was significantly higher in APOE ε4 carriers. Poor baseline cognitive tests, as indicated by MMSE, CDR-SOB, and ADAS-cog subscale 11 (ADAS-cog 11) scores, were significantly associated with progression to AD dementia.
Multivariate Cox analysis included clinical (age, sex, level of education) and statistically relevant variables (APOE ε4 allele, MMSE, ADAS-cog 11, CDR-SOB, and CVRS) (Table 3). Owing to the high correlation between the ADAS-cog and MMSE scores, we analyzed them as Models 1 and 2, respectively. The adjusted covariates did not change the significance of the HRs of CVRS (HR=1.110; 95% CI, 1.043–1.182 for Model 1 and HR=1.084; 95% CI, 1.014–1.159 for Model 2). However, we did not observe significant relationships between baseline MMSE, APOE ε4, and AD dementia progression after adjusting for other covariates. We examined the receiver operating characteristic curve and area under the curve (AUC) to determine the utility of the CVRS for the prediction of prodromal AD compared to each subscale (Table 4). The AUC of the CVRS was higher than that of the other subscales.

DISCUSSION

We assessed the effects of baseline cerebral structural abnormalities evaluated by CVRS on the progression to AD dementia among older patients with prodromal AD. The important finding of the study was that patients with prodromal AD with higher baseline CVRS were more likely to progress to AD dementia during the 3-year follow-up. The early identification of prodromal AD with a high risk of progression to dementia may allow preventive intervention.22) CVRS scores for prodromal AD could help identify patients who are most likely to be referred for intensive preventive care to slow further cognitive decline.23)
The CVRS is composed of cerebral atrophy (23 points) and small vessel disease (7 points) scales, totaling 30 points. Therefore, the CVRS mainly reflects cerebral atrophy in brain MRI, which is a biomarker of neuronal injury or neurodegeneration. Approximately one-quarter of the CVRS comprises scores for small vessel disease, including white matter hyperintensities, lacunar infarcts, and microbleeds. Mixed pathologies, including neurodegenerative and cerebrovascular diseases, have been shown to important for AD dementia in clinical-pathological studies.24) MCI has also been observed in approximately 60% of individuals in combination with vascular pathologies.
Visual scales are more feasible in outpatient clinics because they can be applied without using specific software.7,25) Therefore, visual rating scales such as the CVRS are useful for evaluating subjects in primary clinics, whereas automated analyses are more appropriate for specific research for group analyses in longitudinal studies.25)
Some visual rating scales such as Scheltens’ hippocampal atrophy scale11) have been widely used for AD diagnosis and prediction,26) while other scales have little impact without subsequent replication.27) The CVRS suggests a unified integration of various validated scales related to neuronal and small vascular injury, while others have only assessed a single scale for specific diseases.27) Our findings were consistent with those of previous studies on the validation and correlation of the CVRS with cognitive measures.7)
Our study was limited by the inclusion of prodromal AD subjects as defined by amyloid positivity at baseline from the ADNI cohort, which may have resulted in selection bias. Amyloid PET is increasingly used in clinical practice to focus on study populations comprising prodromal AD rather than heterogeneous MCI subjects. Additionally, the CVRS includes visual rating scales that require experienced clinicians. To address this issue, we provided rater template images for use as a reference for the closest MRI images of the subjects.
In conclusion, the results of this study showed that baseline CVRS scores in patients with prodromal AD were independently associated with progression to AD dementia across a 3-year follow-up period. This finding suggests that the CVRS can be used to predict progression in patients with prodromal AD.

ACKNOWLEDGEMENTS

Data used in this study were downloaded from the Alzheimer’s Disease Neuroimaging Initiative (ADNI) database (adni.loni.usc.edu). The investigators within the ADNI contributed to its design and implementation and/or provided data but did not take part in the analysis or writing of this report. A complete listing of ADNI investigators can be found at http://adni.loni.usc.edu/wp-content/uploads/how_to_apply/ADNI_Acknowledgement_List.pdf.

ACKNOWLEDGMENTS

CONFLICT OF INTEREST

The researchers claim no conflicts of interest.

FUNDING

This study was supported by a research fund from the Korean Geriatric Society, 2018.

AUTHOR CONTRIBUTION

Conceptualization, JWJ; Data curation, JWJ; Funding acquisition, JWJ; Investigation, JKC, JWJ; Methodology, JKC, JWJ; Project administration, JWJ; Supervision, JKJ, JWJ; Writing-original draft, JKC, JWJ; Writing-review & editing, JKC, JWJ.

Fig. 1.
Cox proportional hazards model for progression to Alzheimer disease (AD) dementia in patients with prodromal AD according to comprehensive visual rating scale (CVRS) score: low, ≤16 points; high, >16 points.
agmr-21-0010f1.jpg
Table 1.
Composition of the comprehensive visual rating scale
Adopted or modified scales Scale range
Hippocampal atrophy Scheltens’ scale for coronal image11) 0–8 (bilaterally)
Kim and Jung’s scale for the Axial image12)
Cortical atrophy Victoroff’s scale for frontal and temporal lobe13) 0–9
Koedam’s scale for parietal lobe14)
Subcortical atrophy Donovan’s scale for the anterior and posterior horn of the lateral ventricle15) 0–6
Small vessel disease Modified Fazekas and Scheltens’ scale for white matter hyperintensity16) 0–3
Lacunes and microbleeds: the total number was graded 0–4
Table 2.
Baseline characteristics of patients with prodromal Alzheimer disease
Stable group (n=128) Progressive group (n=61) Total (n=189) p-value
Age (y) 72.6±6.5 72.5±7.0 72.6±6.7 0.933
Sex, female 57 (44.5) 29 (47.5) 86 (45.5) 0.816
Education (y) 16.3±2.8 16.5±2.6 16.3±2.7 0.650
APOE ε4 carriers 77 (60.2) 45 (73.7) 122 (64.5) 0.179
CDR-SOB 1.3±0.8 2.2±1.0 1.6±1.0 <0.001
ADAS-cog 11 8.6±3.6 13.1±4.8 10.1±4.5 <0.001
MMSE 28.0±1.7 27.4±1.9 27.8±1.8 0.028
CVRS (total) 9.9±5.1 12.4±4.9 10.7±5.1 0.002
 Hippocampal atrophy 2.9±2.0 3.9±1.8 3.2±2.0 0.001
 Cortical atrophy 3.6±2.2 4.7±2.2 3.9±2.2 0.002
 Subcortical atrophy 2.1±1.4 2.7±1.4 2.3±1.4 0.019
 Small vessel disease 1.3±1.0 1.2±1.1 1.2±1.0 0.471

Values are presented as mean±standard deviation or number (%).

CDR-SOB, Clinical Dementia Rating sum of boxes; ADAS-cog, Alzheimer’s Disease Assessment Scale cognitive subscale; MMSE, Mini-Mental State Examination; CVRS, Comprehensive Visual Rating Scale.

Table 3.
Univariate and multivariate Cox regression analysis
Univariate analysis
Multivariate analysis
Model 1
Model 2
HR (95% Cl) p-value HR (95% Cl) p-value HR (95% Cl) p-value
Age 1.001 (0.963–1.041) 0.951 0.977 (0.929–1.028) 0.371 0.953 (0.905–1.003) 0.065
Male 0.909 (0.550–1.503) 0.711 0.678 (0.378–1.217) 0.193 0.709 (0.391–1.285) 0.256
Education 1.035 (0.943–1.136) 0.473 1.109 (0.999–1.232) 0.051 1.083 (0.977–1.201) 0.129
APOE ε4 carrier 1.425 (1.001–2.029) 0.049 1.310 (0.866–1.984) 0.202 1.310 (0.875–1.961) 0.189
MMSE 0.848 (0.741–0.971) 0.017 0.866 (0.741–1.012) 0.071 NI NI
ADAS-cog 11 1.221 (1.159–1.285) <0.001 NI NI 1.177 (1.110–1.247) <0.001
CDR-SOB 2.163 (1.715–2.727) <0.001 2.166 (1.684–2.786) <0.0001 1.847 (1.420–2.401) <0.001
CVRS 1.089 (1.034–1.146) 0.001 1.110 (1.043–1.182) 0.001 1.084 (1.014–1.159) 0.019

HR, hazard ratio; CI, confidence interval; ADAS-cog, Alzheimer’s Disease Assessment Scale-cognitive subscale; CDR-SOB, Clinical Dementia Rating sum of boxes; MMSE, Mini-Mental State Examination; CVRS, Comprehensive Visual Rating Scale; NI, not included.

Model 1: adjusted for age, sex, education, APOE ε4 carrier, MMSE, CDR-SOB, and CVRS.

Model 2: adjusted for age, sex, education, APOE ε4 carrier, ADAS-cog 11, CDR-SOB, and CVRS.

Table 4.
AUC comparisons of subscales between progressive and stable MCI
Sensitivity (%) Specificity (%) PPV (%) NPV (%) AUC 95% CI
CVRS 63.9 59.4 42.9 77.6 0.642 0.558–0.726
Hippocampal atrophy 78.7 48.4 42.1 82.7 0.636 0.568–0.703
Cortical atrophy 57.4 64.1 43.2 75.9 0.635 0.551–0.719
Subcortical atrophy 63.9 56.2 41.1 76.6 0.610 0.526–0.694
Small vessel disease 73.8 35.2 35.2 73.8 0.548 0.464–0.632

AUC, area under the curve; MCI, mild cognitive impairment; PPV, positive predictive value; NPV, negative predictive value; CI, confidence interval; CVRS, Comprehensive Visual Rating Scale.

REFERENCES

1. Dubois B, Feldman HH, Jacova C, Hampel H, Molinuevo JL, Blennow K, et al. Advancing research diagnostic criteria for Alzheimer's disease: the IWG-2 criteria. Lancet Neurol 2014;13:614–29.
crossref pmid
2. van Maurik IS, Zwan MD, Tijms BM, Bouwman FH, Teunissen CE, Scheltens P, et al. Interpreting biomarker results in individual patients with mild cognitive impairment in the Alzheimer's Biomarkers in Daily Practice (ABIDE) project. JAMA Neurol 2017;74:1481–91.
crossref pmid pmc
3. Chandra A, Dervenoulas G; Politis M; Alzheimer’s Disease Neuroimaging Initiative. Magnetic resonance imaging in Alzheimer's disease and mild cognitive impairment. J Neurol 2019;266:1293–1302.
crossref pmid
4. McKhann GM, Knopman DS, Chertkow H, Hyman BT, Jack CR Jr, Kawas CH, et al. The diagnosis of dementia due to Alzheimer's disease: recommendations from the National Institute on Aging-Alzheimer's Association workgroups on diagnostic guidelines for Alzheimer's disease. Alzheimers Dement 2011;7:263–9.
crossref pmid pmc
5. Albert MS, DeKosky ST, Dickson D, Dubois B, Feldman HH, Fox NC, et al. The diagnosis of mild cognitive impairment due to Alzheimer's disease: recommendations from the National Institute on Aging-Alzheimer's Association workgroups on diagnostic guidelines for Alzheimer's disease. Alzheimers Dement 2011;7:270–9.
crossref pmid pmc
6. Schneider JA, Arvanitakis Z, Leurgans SE, Bennett DA. The neuropathology of probable Alzheimer disease and mild cognitive impairment. Ann Neurol 2009;66:200–8.
crossref pmid pmc
7. Jang JW, Park SY, Park YH, Baek MJ, Lim JS, Youn YC, et al. A comprehensive visual rating scale of brain magnetic resonance imaging: application in elderly subjects with Alzheimer's disease, mild cognitive impairment, and normal cognition. J Alzheimers Dis 2015;44:1023–34.
crossref pmid
8. Jang JW, Park JH, Kim S, Park YH, Pyun JM, Lim JS, et al. A 'Comprehensive Visual Rating Scale' for predicting progression to dementia in patients with mild cognitive impairment. PLoS One 2018;13:e0201852.
crossref pmid pmc
9. Wechsler D. WMS-R: Wechsler Memory Scale-Revised manual. San Antonio, TX: Harcourt Brace Jovanovich; 1987.

10. Jack CR Jr, Bernstein MA, Fox NC, Thompson P, Alexander G, Harvey D, et al. The Alzheimer's Disease Neuroimaging Initiative (ADNI): MRI methods. J Magn Reson Imaging 2008;27:685–91.
crossref pmid pmc
11. Scheltens P, Leys D, Barkhof F, Huglo D, Weinstein HC, Vermersch P, et al. Atrophy of medial temporal lobes on MRI in "probable" Alzheimer's disease and normal ageing: diagnostic value and neuropsychological correlates. J Neurol Neurosurg Psychiatry 1992;55:967–72.
crossref pmid pmc
12. Kim GH, Kim JE, Choi KG, Lim SM, Lee JM, Na DL, et al. T1-weighted axial visual rating scale for an assessment of medial temporal atrophy in Alzheimer's disease. J Alzheimers Dis 2014;41:169–78.
crossref pmid
13. Victoroff J, Mack WJ, Grafton ST, Schreiber SS, Chui HC. A method to improve interrater reliability of visual inspection of brain MRI scans in dementia. Neurology 1994;44:2267–76.
crossref pmid
14. Koedam EL, Lehmann M, van der Flier WM, Scheltens P, Pijnenburg YA, Fox N, et al. Visual assessment of posterior atrophy development of a MRI rating scale. Eur Radiol 2011;21:2618–25.
crossref pmid pmc
15. O'Donovan J, Watson R, Colloby SJ, Firbank MJ, Burton EJ, Barber R, et al. Does posterior cortical atrophy on MRI discriminate between Alzheimer's disease, dementia with Lewy bodies, and normal aging? Int Psychogeriatr 2013;25:111–9.
crossref pmid
16. Scheltens P, Erkinjunti T, Leys D, Wahlund LO, Inzitari D, del Ser T, et al. White matter changes on CT and MRI: an overview of visual rating scales. European Task Force on Age-Related White Matter Changes. Eur Neurol 1998;39:80–9.
crossref pmid
17. Johnson KA, Minoshima S, Bohnen NI, Donohoe KJ, Foster NL, Herscovitch P, et al. Appropriate use criteria for amyloid PET: a report of the Amyloid Imaging Task Force, the Society of Nuclear Medicine and Molecular Imaging, and the Alzheimer's Association. Alzheimers Dement 2013;9:e-1-16.
crossref pmid pmc
18. Rosen WG, Mohs RC, Davis KL. A new rating scale for Alzheimer's disease. Am J Psychiatry 1984;141:1356–64.
crossref pmid
19. Hothorn T. Package “maxstat”: Maximally Selected Rank Statistics [Internet]. Vienna, Austria: R-project.org; 2015 [cited 2021 Mar 15]. Available from: http://CRAN.R-project.org/package=maxstat.

20. Therneau TM. Package “survival”: Survival Analysis [Internet]. Vienna, Austria: R-project.org; 2015 Available from: https://CRAN.R-project.org/package=survival.

21. Wickham H. ggplot2: elegant graphics for data analysis. New York, NY: Springer-Verlag; 2009.

22. Pankratz VS, Roberts RO, Mielke MM, Knopman DS, Jack CR Jr, Geda YE, et al. Predicting the risk of mild cognitive impairment in the Mayo Clinic Study of Aging. Neurology 2015;84:1433–42.
crossref pmid pmc
23. Rafii MS, Aisen PS. Alzheimer's disease clinical trials: moving toward successful prevention. CNS Drugs 2019;33:99–106.
crossref pmid pmc
24. Kapasi A, DeCarli C, Schneider JA. Impact of multiple pathologies on the threshold for clinically overt dementia. Acta Neuropathol 2017;13:171–86.
crossref
25. Menendez Gonzalez M, Suarez-Sanmartin E, Garcia C, Martinez-Camblor P, Westman E, Simmons A. Manual planimetry of the medial temporal lobe versus automated volumetry of the hippocampus in the diagnosis of Alzheimer's disease. Cureus 2016;8:e544.
pmid pmc
26. Dubois B, Feldman HH, Jacova C, Dekosky ST, Barberger-Gateau P, Cummings J, et al. Research criteria for the diagnosis of Alzheimer's disease: revising the NINCDS-ADRDA criteria. Lancet Neurol 2007;6:734–46.
crossref pmid
27. Harper L, Barkhof F, Fox NC, Schott JM. Using visual rating to diagnose dementia: a critical evaluation of MRI atrophy scales. J Neurol Neurosurg Psychiatry 2015;86:1225–33.
crossref pmid
TOOLS
Share :
Facebook Twitter Linked In Google+ Line it
METRICS Graph View
  • 1 Web of Science
  • 1 Crossref
  • 1 Scopus
  • 3,693 View
  • 74 Download
Related articles in
Ann Geriatr Med Res


ABOUT
ARTICLE & TOPICS
Article Category

Browse all articles >

TOPICS

Browse all articles >

BROWSE ARTICLES
EDITORIAL POLICY
FOR CONTRIBUTORS
Editorial Office
#401 Yuksam Hyundai Venturetel, 20, Teheran-ro 25-gil, Gangnam-gu, Seoul 06132, Korea
Tel: +82-2-2269-1039    Fax: +82-2-2269-1040    E-mail: agmr.editorial@gmail.com                

Copyright © 2024 by Korean Geriatrics Society.

Developed in M2PI

Close layer
prev next