


INTRODUCTION
The growth of the aging population has led to an increasing number of older drivers. Perception in vision and hearing and cognitive and psychomotor skills are attenuated during aging; hence, older drivers experience visual impairment, cognitive decrements, reduced judgment ability in complex traffic environments, and medical disorders.1) Age appears to contribute to increased road collisions as older drivers have a higher fatality rate in vehicle crashes owing to multiple chronic medical conditions and frailty than younger drivers.2)
Healthcare providers should advise older drivers to stop driving or help them continue driving safely using bespoke evaluation tools to improve the fitness of older drivers.3) On-road testing is an acceptable standard method to assess driving capacity; however, it is time-consuming and expensive to set up various test courses and can be inappropriate for older drivers who may cause dangerous situations during the test.4-6) Therefore, vehicle simulators are accepted as adequate tools to test driving capacity with regard to aptitude and performance. Driving simulation shows potential for use in the testing and training of older drivers. Vehicle simulators are also reportedly a safer and more economical method than on-road tests for assessing the driving capacity of older drivers.4) However, the validity of vehicle simulators varies with simulator models and specific driving tasks; moreover, vehicle simulators have not been validated as a reliable tool for evaluating the driving capacity of older drivers.7)
Available online or office-based simple screening tools are valid and reliable methods for assessing fitness to drive.8) Self-assessment tools for the screening of older drivers at risk of unsafe driving include testing driver safety, a 15-item self-rating driving questionnaire, the American Automobile Association (AAA) Drivers 65 Plus, the Driving Decisions Workbook, and the Fitness-to-Drive Screening Measure.3) The Driving Behavior Questionnaire is also a reliable tool for measuring older driversŌĆÖ self-reported aberrant driving behaviors.8) As a more objective measure, the Clinical Assessment of Driver-Related Skills (CADReS), an office-based assessment tool, has been widely used to indirectly measure crash risk in key areas of vision, cognition, and motor/sensory function. Functional abilities are reportedly more important than age in screening older drivers at risk.9)
Instead of on-road tests, objective and subjective assessment tools can be used to evaluate driving capacity of older drivers compared with the driving capacity of young drivers. We hypothesized that the driving capacity of older drivers would be inferior to that of young drivers. We evaluated the driving capacity, including sensory, motor, and cognitive skills, of older drivers using three different assessment tools (self-assessment questionnaire, CADReS, and vehicle simulator) and screened valid assessment tools by comparing their results to those of non-older drivers.
MATERIAL AND METHODS
Study Participants
Older drivers (aged 65 years and over) were recruited among visitors at a senior welfare center located in Anyang City, and non-older drivers (aged below 65 years) were recruited among workers at Yongsan Electronics Market in Seoul, South Korea. The inclusion criterion was a valid Korean driverŌĆÖs license. The exclusion criteria were not driving or having a history of seizure for at least 1 year before participation. The participants were classified as older or non-older drivers. This study was conducted at the Mini Driving Simulation Center in Seoul between November 11, 2019 and 20, 2019.
Development of the Self-assessment Questionnaire
We developed a self-assessment questionnaire to evaluate driving habits, driving-related health behaviors, and morbidities based on the ClinicianŌĆÖs Guide to Assessing and Counseling Older Drivers.3) The questionnaire comprises 52 questions: 5 on demographic characteristics, 22 on driving habits, 5 on health behaviors, and 20 on chronic medical conditions that may affect driving. The assessment was administered as a personal interview survey performed directly after the driving simulation test.
CADReS
The present study used the CADReS, developed by the American Medical Association, as a second-step evaluation.3) We assessed visual acuity and field; evaluated motor function using the rapid walking pace test and manual tests of motion range; and tested cognitive function using the maze test, trail-making test part B, clock-drawing test, and Korean-Montreal Cognitive Assessment (KMoCA). The assessment was conducted by two transport engineers at the Korea Transportation Safety Authority (KOTSA) who were trained to conduct interviews and assess driving-related functions by an emergency medicine specialist based on the ClinicianŌĆÖs Guide to Assessing and Counseling Older Drivers.3) The survey required approximately 30 minutes to complete, including an introduction to the purpose and methods of the assessment.
Driving Simulation Setting
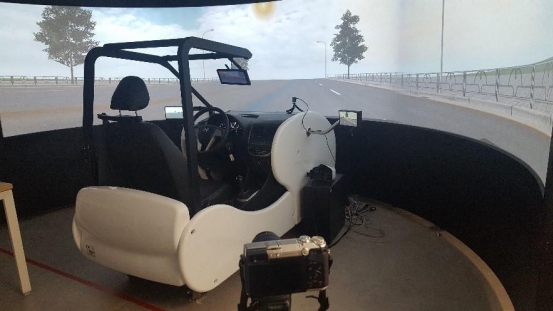
The driving simulation was conducted using a compact driving simulation (CDS; Inno Simulation Co. Ltd, Seoul, Korea) at the Yongsan Laboratory in the University of Seoul. The CDS comprises a steering wheel, pedals (accelerator, brake), gears, seats, and an instrument panel as parts of the actual vehicle. Three beam projectors are connected to three computers displayed on each screen to prevent frame drop owing to multiple displays. In addition, three display panels are attached to the CDS to display the left-side mirror, right-side mirror, and room-mirror screen to make the driving experience as realistic as possible (Fig. 1).
Virtual driving data were recorded using the vehicle simulator Log Data, a function provided by UC-win/Road (FORUM8 KOREA, Anyang, Korea). This function automatically collects driving time, driving speed, driving distance, acceleration and deceleration speeds, brake power, revolutions per minute, steering wheel rotation angle, and one-way location.
Development of the Driving Simulation Scenarios
The driving simulation for older and non-older participants was performed using four junctions as follows: a right turn at an acute junction, going straight at an acute junction, pedestrian present at the right turn at a typical junction, and a left turn at an acute junction in the dark. The four junction scenarios were developed based on the analysis of accidents involving older drivers at urban junctions obtained from the Traffic Safety Information Management Complex System by the KOTSA. The simulation scenarios were developed from actual roads by replicating road geometrics and traffic control devices located in Jungnang-gu, Seoul, South Korea.
Variables and Measurements
The main exposures for comparison between the two groups were demographics, driving behaviors, health behaviors, morbidities, and CADReS and driving simulation outcomes. Driving behaviors included driving career, driving frequency, driving time, mileage driven, night driving, parking methods, driving speed, driving capacity, road traffic incidences, traffic tickets, and difficulties in specific situations. Health behaviors included smoking, alcohol consumption, exercise, insomnia, and sleep apnea. Morbidities included hypertension; diabetes; and ophthalmic, ear, joint, and heart disorders.
We performed the CADReS according to the instructions provided in the ClinicianŌĆÖs Guide to Assessing and Counseling Older Drivers.3) The survey, including an introduction to the purpose and methods of the tests, required approximately 30 minutes to complete.
Using a vehicle driving simulator, we assessed collisions, velocity (maximum, at the junction), and traffic violations (recognition of pedestrians, obeying the stop line, lane keeping, and obeying traffic signals) in the four scenarios. The participants were previously instructed regarding the use of all operational parts of the driving vehicle (steering, gas and brake pedals, seat belt, rear mirror, and turn signals).
Statistical Analysis
Categorical variables are expressed as frequencies and percentages, while continuous variables are expressed as mean┬▒standard deviation or as medians and interquartile range (IQR). Chi-square or Fisher exact tests were used for categorical variables and Wilcoxon tests for continuous variables. The AUCs (areas under the receiver operating characteristic [ROC] curves) were calculated to compare the age-related discriminatory power of the assessment tools. DeLong tests were used to compare AUCs.10) All statistical analyses were performed using SPSS Statistics for Windows, version 23.0 (IBM Corp., Armonk, NY, USA). p-values were two sided, with a significance level of 0.05.
RESULTS
Among 40 participants after excluding four who complained of simulator sickness, 30 (75.0%) were older drivers. The median (IQR) age of the older drivers was 71.5 (68.0ŌĆō73.25) years, and 27 participants (90.0%) were male. The median (IQR) age of the 10 non-older drivers was 42.0 (25.0ŌĆō46.75) years, and 3 participants (30.0%) were male. Older drivers with driving experiences of over 20 years comprised 96.7% of this population. Among non-older drivers, 72.8% had driving experiences of less than 20 years. Older drivers were more likely to drive once or twice per week for 1ŌĆō2 hours per day. However, most driving behaviors did not differ significantly between the two groups (Table 1).
While none of the health behaviors differed significantly between older and non-older drivers, there were clinical differences in terms of the presence of chronic conditions between the two groups. Among older drivers, 20 (66.7%) had hypertension, 7 (23.3%) had diabetes mellitus, 9 (30.0%) had cataracts, 4 (13.3%) had glaucoma, 2 (6.7%) had macular degeneration, 6 (20.0%) had degenerative arthritis, 4 (13.3%) had hearing impairment, and 3 (10.0%) had cardiovascular disease. None of the non-older drivers had these chronic conditions (Table 2).
Table 3 shows the results of the CADReS: 6 older drivers (20.0%) had visual field defects; regarding motor function, older drivers were slower than non-older ones in the rapid walking pace test (8.0 vs. 6.1 seconds; p<0.001); regarding cognitive function, the results of older drivers were worse than those of non-older drivers for the KMoCA (25.0 vs. 28.3; p=0.001), maze test (29.2 vs. 18.4 seconds; p=0.004), and trail-making test (117 vs. 51 seconds; p<0.001). Four older drivers took longer than 180 seconds to complete the trail-making test (data not shown). However, performance on the clock-drawing test did not differ significantly between the two groups (older 6.6 vs. non-older 7.0; p=0.166).
Table 4 shows the results of the comparisons of simulation test results between the two groups. In the simulation, while the frequency of crashes and violation rates of the central and stop lines were higher in older drivers than in non-older drivers, the differences were not statistically significant. The rates of right indicator use in the left turn at night and in the right turn at the oblique junction were higher in older drivers than in non-older drivers (p=0.014 and p=0.708, respectively). Maximal velocity and velocity at the cross-section were higher in non-older drivers than in older drivers (p<0.05).
The results of the ROC curve analyses are shown in Table 5. The AUC values for the CADReS and driving simulation outcomes ranged from 0.783 to 0.952, indicating moderate to high assessment accuracy, except for the clock-drawing test (AUC>0.587).11) The rapid walking pace test, trail-making test, and velocity of the left turn at the acute junction in the dark showed high discriminatory powers (AUC>0.9). Table 6 shows the differences in AUCs between the highest assessment accuracy variable, left-turn velocity at night, and other variables. The maze test results showed statistically signi’¼ücant differences (p=0.044), while the results of the KMoCA (p=0.051), right turn at an oblique intersection (p=0.051), and going straight (p=0.073) approached borderline significance.
DISCUSSION
In this study, we observed that the motor (rapid walking pace) and cognitive (KMoCA, maze test, trail-making test) functions of older drivers were inferior to those of non-older drivers. Older drivers who were tested on four junction scenarios implemented in a vehicle simulator drove slower than non-older drivers. In particular, the simulation of left turns at night showed the highest discriminatory power between older and non-older drivers.
The comparisons of visual sensory, motor, and cognitive functions using the CADReS showed that older drivers were inferior to non-older drivers. Rapid walking pace and trail-making time showed high accuracy (AUC>0.9) to discriminate motor and cognition functions, respectively, between older and non-older drivers. In the present study, older and non-older drivers required a mean of 8.0 and 6.1 seconds, respectively, to complete the rapid walking pace assessments. Older drivers requiring >9 seconds to complete the rapid pace walking assessment were recommended to consult a physician.3,12) Other studies reported that rapid walking pace measures >7 seconds were associated with an increased crash risk among older drivers.13) The trail-making test, which evaluates cognitive ability related to attention, visual processing, and working memory, was correlated with driving outcomes.14) Four older drivers in the present study who required >180 seconds for task completion in this test were recommended to consult a physician.15)
Vehicle simulators can be used to assess driver capacities such as driving skills and cognition.4,16,17) These simulators are commonly used in clinical settings because of their high fidelity, safe environment, and reproducibility.5,18) Driving simulation was reported to be a valid predictor of on-road driving capacity among older drivers.4) Absolute driver response validity indicates that the same result would be observed between simulation and real life. Even though there were no statistical differences between older and non-older drivers with respect to driving speed and capacity on the self-assessment questionnaire, the driving speed of older drivers was lower than that of non-older drivers during the simulation. As the absolute validity of the vehicle simulator used in this study was not assessed, future studies are warranted to validate the simulator. Another study also reported that older drivers drove at slower speeds in a vehicle simulator, which was related to a lower confidence level in these drivers.6) However, the vehicle simulator is not an alternative tool to the on-road test but rather is a useful method for assessing driving-related cognitive skills and training regarding on-road driving skills in drivers with cognitive deficits.19,20)
Age itself may be a risk factor for safe driving as aging reduces driving capacity through decreased cognition and attentional capacity.21) Self-assessment surveys are relatively easy and efficient methods for collecting data regarding violations, errors, and lapses. Driver behavior questionnaires are widely used self-assessment tools to measure aberrant driving behaviors in the field of road safety, in which violation scores are correlated with self-reported accidents and driving speed in a simulator.22,23) In the present study, the driving behaviors of older drivers did not differ from those of non-older drivers in terms of the subjective questionnaire, despite chronic disorders such as hypertension, diabetes mellitus, cataract, glaucoma, macular degeneration, and arthritis in older drivers.
Our findings of slower speed at cross-sections and worse lane-keeping behavior in older drivers are related to their self-regulating behaviors.24) The poorer capacity of older drivers makes them avoid problematic driving situations in which they have low confidence. In addition, reduced contrast sensitivity contributed to decreased recognition and capacity, which led to a notable decline in driving speed at night.25) However, older drivers adapt and behave safely when faced with difficult situations owing to their lengthy driving experiences.24) Therefore, older driversŌĆÖ increased use of indicators when turning at junctions may be associated with safe behaviors such as an increase in following distance while driving.
This study had several limitations. First, as in most driving simulation studies, the sample size was too small, which lowered the study power. Moreover, the sizes of the older and non-older driver groups differed substantially, which could explain the non-significant results in the comparisons of the two groups. The low rate of women in the older driver group and the low rate of men in the non-older driver group also hindered the evaluation of driving behaviors of older male and female drivers.
In conclusion, the results of our study showed that motor (rapid walking pace) and cognitive function tests (i.e., KMoCA, maze test, and trail-making tests) in the CADReS, as well as driving simulations using junction scenarios, were good tools to discriminate between older and non-older drivers. A prospective validation study with a larger sample is needed to determine whether these tools can assess the fitness to drive among older drivers potentially at risk.