


INTRODUCTION
Alterations in physical and cognitive functions with age are generally related to adverse health outcomes. Skeletal muscle mass,1) grip strength,2) and gait speed3) gradually decrease with age. Structural and functional changes related to disability4,5) increase the risk of mortality.6-8) Cognitive function comprises multiple domains that change with age.9) Some domains of cognitive function, such as memory, information processing speed, search speed, and verbal memory, are associated with survival in later adulthood.10-12)
Rheumatoid arthritis (RA) is a chronic inflammatory disease. Patients with RA experience pain, and insufficient disease control may result in cartilage damage.13) Skeletal muscle mass, gait speed, and grip strength are lower in patients with RA than in community-dwelling adults because of this burden.14) Additionally, the estimated number of older patients with RA is increasing15,16) due to a surge in late-onset RA17) and decreasing mortality.18) The number of older patients with RA and the number of patients with RA having a high risk of disability are increasing. However, the association between RA and cognitive function is unclear. Opposing mechanisms are involved in the association between RA and cognitive function, and evidence of the association between the two is limited. A population-based case-control study reported an inverse association between a history of RA and Alzheimer disease.19) Other studies have shown higher risks of dementia in patients with RA,20-22) chronic inflammation with neurological involvement, accelerated atherosclerosis, and subsequent cognitive impairment.23) Biological disease-modifying antirheumatic drugs and anti-tumor necrosis factor drugs may have beneficial effects on cognitive impairment.24)
Most previous studies have not matched the controls for comparisons of physical and cognitive functions and have not monitored the changes in these functions using longitudinal data. Hence, in this study, we aimed to identify longitudinal changes in physical and cognitive functions in participants with RA compared with those in community-dwelling adults. We evaluated middle-aged and older adults separately because changes in physical function vary between the two age groups.25-27)
MATERIAL AND METHODS
Study Participants
This study was conducted as part of the National Institute for Longevity SciencesŌĆōLongitudinal Study of Aging (NILS-LSA).28) This population-based prospective cohort study screens for aging and age-related diseases. In this project, the normal aging process was assessed using detailed questionnaires, medical checkups, anthropometric measurements, physical fitness tests, and nutritional examinations. The participants were a random sample of community-dwelling adults who were stratified based on age and sex. They were aged 40ŌĆō79 years at the time of their initial participation and lived in Obu-shi and Higashiura-cho, Aichi Prefecture, Japan. These participants were followed up every 2 years from the first (November 1997ŌĆōApril 2000) to the second (April 2000ŌĆōMay 2002), third (May 2002ŌĆōMay 2004), fourth (June 2004ŌĆōJuly 2006), fifth (July 2006ŌĆōJuly 2008), sixth (July 2008ŌĆōJuly 2010), and seventh (July 2010ŌĆōJuly 2012) study waves. When participants could not be followed up, new age-(decade) and sex-matched participants were randomly recruited from the second to seventh study waves, and individuals aged 40 years were newly recruited every year. The study protocol was approved by the Committee of Ethics of Human Research of the National Center for Geriatrics and Gerontology (No. 1633). Written informed consent was obtained from all participants. Also, this study complied the ethical guidelines for authorship and publishing in the Annals of Geriatric Medicine and Research.29)
The total number of NILS-LSA participants was 3,983. We included individuals who did not report having medical conditions that could affect physical and cognitive functions, such as a history of stroke, heart disease, cancer, or dementia, using a self-administered questionnaire at baseline. Individuals were categorized into the RA and control groups. Participants with RA (RA group) were defined as those who answered that they had received RA treatment, had been treated for RA, or were not currently treated but had been treated for RA previously in the fifth to seventh study wave questionnaires because we did not distinguish between RA and other forms of arthritis, such as osteoarthritis, until the fourth study wave. The baseline for participants with RA was defined as the study wave in which they first answered that they had RA or arthritis. We excluded participants with RA who did not join the NILS-LSA more than twice. We selected the controls as follows: first, we randomly selected controls without RA whose age and sex matched those of participants with RA in the first wave in a ratio of 2:1. After excluding the participants selected as controls in the first study wave, we selected controls in the second study wave in the same manner as that in the first study wave. When those in the control group did not participate in the NILS-LSA more than twice, we selected other control participants. We repeatedly selected controls until the sixth study wave. Finally, 42 participants with RA and 84 controls were chosen.
Measurements
Physical function (baseline and follow-up survey)
Appendicular lean mass (ALM), grip strength, and gait speed were assessed as physical functions. ALM was assessed using a dual-energy X-ray absorptiometer (QDR-4500; Hologic, Bedford, MA, USA).30) The skeletal muscle mass index (SMI) was calculated as the ALM divided by the height squared (kg/m2). Grip strength was measured using a handgrip dynamometer (T.K.K.4301a; Takei, Niigata, Japan). In this assessment, the participants were instructed to hold a hand grip dynamometer while standing with their arms at their sides and their elbows extended and to squeeze with maximum force, alternating the left and right hands twice.31) A maximum of two readings from each hand was used as the measurement result. Gait speed was assessed using a walking analysis system (YW-3; Yagami Co., Aichi, Japan).32) The participants walked at a comfortable speed on an 11-m straight walkway, including acceleration and deceleration. The start and end times to walk 10 m were recorded using light sensors, and habitual gait speed was measured three times by calculating the time in meters per second. The gait speed was determined from the first trial wherein stride length, pitch, and gait speed were measured simultaneously and used as the measurement result.
Cognitive function (baseline and follow-up survey)
Cognitive abilities were assessed using the Japanese version of the Wechsler AdultsŃĆĆIntelligence Scale-Revised Short Form (WAIS-R-SF).33) The WAIS-R-SF consists of information, similarity, picture completion, and digit symbol substitution scales. Trained clinical psychologists or graduate students specializing in psychology administered the test to the participants individually. The information test evaluates general knowledge about people, places, and events (29 items; possible range, 0ŌĆō29). The similarities test assesses logical abstract thinking by asking participants to state how similar two things are to each other (14 items; possible range 0ŌĆō28). The picture completion test gauges visual perception and long-term visual memory by asking participants to spot the missing elements in a series of drawings (21 items, possible range 0ŌĆō21). The digit symbol substitution test measures processing speed by asking participants to write as many symbols as possible that correspond to a given number in 90 seconds (possible range 0ŌĆō93). In all tests, higher scores indicate better cognitive function.
Covariates (baseline)
At baseline, data on age, sex (male, female), education level (Ōēź12 years, <12 years), and history of hypertension or diabetes mellitus (none, presence) were collected using a self-administrated questionnaire. Body weight and height were measured using digital scales to the nearest 0.1 kg and 0.1 cm, respectively. The participants were requested to wear light clothing and no shoes. Body mass index (BMI) was calculated as the body weight in kilograms divided by the square of the height in meters. According to BMI, the participants were categorized into three groups: <18.5, Ōēź18.5 and <25, and Ōēź25 kg/m2.34)
Statistical Analysis
The participants were classified into two age groups: <65 years (40ŌĆō64 years) and Ōēź65 years (65ŌĆō79 years) at baseline because the slope of decreasing physical function differs between middle-aged and older adults.25-27) We analyzed the data according to these groups. When certain variables were missing for a participant, the entire data for that participant in the same wave were deleted. Subsequent analysis was performed by age group. The baseline characteristics in the RA and control groups were examined using t-test or chi-square tests in each age group. General linear mixed models were used to evaluate the effects of RA presence on longitudinal changes in physical and cognitive functions. The model used in this study included fixed terms for the intercept, case (RA or control), age (at baseline), time (time in years since baseline), and case├Śtime interaction. The case├Śtime interaction was expected to indicate whether the change in physical and cognitive functions varied according to the presence or absence of RA. A history of hypertension or diabetes, BMI categories (for physical function),35) and education categories (for cognitive function)36) were considered covariates. Additionally, the models included random intercepts and slope terms that captured participant-specific deviations.
All statistical data were analyzed using SAS System (version 9.3; SAS Institute, Cary, NC, USA). Two-tailed p<0.05 was considered statistically significant.
RESULTS
Table 1 shows the baseline characteristics of the RA and control groups according to age. The physical and cognitive functions at baseline did not differ significantly between the two groups in either age group. The follow-up time in the RA group was significantly longer than that in the control group aged Ōēź65 years.
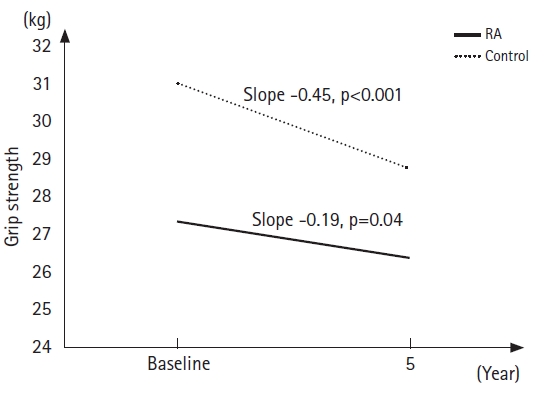
Table 2 presents the results of the general linear mixed-model parameter estimates for physical function in each age group. The parameter estimates of fixed effects for the follow-up years declined significantly for grip strength (both p<0.001) in both age groups and for SMI (p<0.01) and gait speed (p=0.01) in the group aged Ōēź65 years. The average grip strength of the RA group aged Ōēź65 years was significantly lower than that of the control group (p=0.01). The interaction effect of case├Śtime was significant for grip strength in the group aged Ōēź65 years. Fig. 1 illustrates the grip strength changes in the group aged Ōēź65 years, which were estimated by substituting baseline age, follow-up years, and the effects of the case├Śtime interaction (Fig. 1). The slope of the grip strength change in the control group was steeper (slope = ŌłÆ0.45) than that in the RA group (slope = ŌłÆ0.19). Regarding cognitive abilities, the information (p<0.001) and similarity (p=0.01) scores increased with follow-up years in the group aged <65 years. The average picture completion score increased with follow-up years in both age groups (p < 0.001 for <65 years; p=0.03 for Ōēź65 years). However, no significant difference in cognitive function scores was observed between the RA and control groups. Furthermore, no significant effects of case ├Ś time interaction for each cognitive domain were observed in either age group (Table 3).
DISCUSSION
This study examined the longitudinal changes in physical function and cognitive abilities among the RA group compared to those in non-RA controls selected from a large community-based cohort. The interaction between case and follow-up time for grip strength in the group aged Ōēź65 years was significant. The decline in grip strength in the control group was greater than that in the RA group. Our results did not reveal greater decreases or increases in physical or cognitive function in the RA group compared with those in the control group.
Furthermore, except for grip strength, we did not observe significant differences in physical and cognitive functions between the RA and control groups. In this study, grip strength decreased in both groups, with parameter estimates of grip strength for follow-up years of -0.31 and -0.45 for the groups aged <65 years and Ōēź65 years, respectively. This result was unexpected; moreover, previous studies have suggested an association of chronic inflammation with disability and dementia20,21,37) and reported that the changes in grip strength in RA populations were not affected by age but by other factors such as disease duration and disease activity.38) A meta-analysis of the general population aged 20ŌĆō100 years and RA population aged 31ŌĆō65 years showed that grip strength decreased gradually with age, with a steeper decline at 50 years of age.38) In contrast, the grip strength in the RA group was lower than that in the general population, did not show a steeper decline during middle age, and was associated with disease duration.38) Our results were similar to those of a previous report showing that the grip strength of the RA group was lower than that of the control group and that the decline in the grip strength for the RA group was slower than that of the control group. The reduced grip strength might be due to disease duration or factors other than aging. The decline in grip strength in the RA group was slower than that in the control group, which was caused by the low grip strength of the RA group at the beginning of the follow-up. This may be because the case├Śtime interaction for grip strength was significant in the group aged Ōēź65 years. Longitudinal studies are required to clarify the changes in grip strength in the RA and control groups.
Our results revealed a significant inverse association between SMI and aging in the group aged Ōēź65 years but not in the group aged <65 years. Longitudinal changes in SMI did not differ significantly between the RA and control groups. A cross-sectional study of healthy community-dwelling adults aged 40ŌĆō79 years reported that SMI decreased gradually from middle age.39) A 12-year follow-up longitudinal study in community-dwelling adults aged 40ŌĆō79 years showed that SMI decreased with age, except in middle-aged men.30) The association between SMI and aging in our study is in line with the previously reported results. In our study, gait speed decreased significantly in the group aged Ōēź65 years but did not decrease in the group aged <65 years. Gait speed began to decrease in approximately the 60s.26) The change in SMI and gait speed with age did not differ significantly in the RA and control groups, and the decline in gait speed in the RA group also likely occurred in the control group.
Crystalized intelligence increased with follow-up years in both the RA and control groups aged <65 years. The picture competition score, which reflects fluid intelligence, also increased with age in age groups. A cross-sectional study of participants aged 18ŌĆō99 years showed that crystallized intelligence increased until the sixth decade and was maintained or decreased slightly thereafter, while fluid intelligence declined from middle age.40) Our results on crystallized intelligence were consistent with those reported previously.40 The difference in picture completion may be affected by participant memory. As our study participants answered the same questions repeatedly, their knowledge of the previous questions and answers might have influenced their subsequent correct answers. Chronic inflammation causes atherosclerosis and cognitive impairment.23,41) In contrast, antirheumatic drugs may exert beneficial effects on cognitive impairment.24) The findings regarding the association between RA and cognitive function remain debatable. We do not have a clear explanation for the lack of difference in the change in cognitive function between the RA and control groups.
This study has several limitations. First, the participants were recruited from a random sample of community-dwelling middle-aged and older adults. However, they were relatively physically or mentally healthy because they could repeatedly participate in the study at our institution. Additionally, the number of study participants was small. Therefore, our findings cannot be extrapolated to patients with RA with severe disabilities. Second, we did not define RA based on diagnostic criteria,42) which might have led to misclassification. Third, the follow-up time in the RA group was longer than that in the control group aged Ōēź65 years. However, these differences may not have affected the results of the analysis because the 2-year interval of each wave might have affected the difference and the number of participants did not differ significantly between the RA and control groups. Finally, patients with RA might have stiffness or deformity in their fingers, which might have caused decreased grip strength. Information on disease severity, duration, finger stiffness or deformity, and use of disease-modifying antirheumatic drugs was not collected. Although we did not collect information on the factors that affect physical function, participants with RA might have maintained their physical function because their baseline characteristics were not significantly different from those of the control group.
Chronological changes in physical and cognitive functions with aging are comparable between participants with RA and community dwellers without RA; however, the grip strength of those in the participants with RA showed a greater decline in older adults without RA.